


The table of content
This article is a summary of the scientific work published by Oleksii Oleksiuk, Oleksandr Shafalyuk
The original source can be accessed via DOI 10.33111/nfmte.2023.155
In the context of today’s fast-evolving social and economic landscape, businesses are experiencing unprecedented levels of volatility and complexity in their operations. This is especially true for companies engaged in commerce and logistics, where managers must constantly assess both qualitative and quantitative parameters to remain competitive and profitable. While traditional business management tools—such as cost optimization, demand forecasting, and budget planning—remain important, they are no longer sufficient on their own. Modern business practices increasingly require the integration of functions across multiple organizations, including partnerships and outsourcing arrangements.
A major challenge facing corporate leaders is balancing two opposing forces: the need for competitive differentiation and the push for global integration. These forces, while essential for growth, often stand in contradiction—demanding that businesses maintain a unique edge while also harmonizing their operations with partners and customers. This tension has significant implications for the structure of commercial and managerial systems.
Simultaneously, the rapid advancement of digital and commercial technologies—largely driven by breakthroughs in IT—has led to a massive increase in data availability. Modern devices and platforms generate enormous volumes of raw data, providing new opportunities to track consumer behavior, merge diverse datasets, and foster innovation. However, this abundance of information also compresses the timeline for decision-making. Corporate managers now face greater pressure to make faster decisions, often under time constraints, while still needing analytical justification for their choices.
Yet, not all decisions require deep, time-consuming analysis—some rely more on strategic intuition or agile responses. This raises a critical question for business leaders: how can managerial mechanisms be adapted or modernized to function effectively in this high-pressure, data-rich environment? The ability to update and refine decision-making frameworks is becoming a vital success factor, with both practical and theoretical significance for the future of business operations.
Analysis of recent research and publications
The current landscape of pharmaceutical e-commerce is undergoing rapid transformation, driven by the need for advanced managerial practices and data-driven decision-making. Research over the past several years has focused on two interconnected directions: the administrative and strategic management of online retail operations, and the use of AI and data mining to analyze consumer behavior. These areas are critical for managing the complexity of pharmaceutical goods, which involve high product variety, strict regulatory standards, and sensitive consumer needs.
Key studies illustrate the evolution of tools and approaches in this space. Zhang et al. introduced the use of Kohonen Self-Organizing Maps (SOM) to profile online consumer behavior and enhance targeting strategies. Bradlow et al. emphasized blending diverse user data sources and incorporating Bayesian predictive models to optimize retail decision-making. Sulthana and Ramasamy developed a neuro-fuzzy recommendation system based on user reviews, while Nilashi et al. highlighted the potential of multi-criteria collaborative filtering in product recommendation—especially relevant for sparse data environments like online pharma platforms.
Additional research by Liao et al. applied clustering and association rule learning to explore brand extension strategies, a valuable approach for Ukrainian pharmaceutical e-retailers who offer many interchangeable products within one category. Meanwhile, studies on advertising strategies, like those using the Data Envelopment Analysis model, support decision-making in budget allocation and campaign effectiveness.
The logistics dimension of e-commerce, a critical component of operational efficiency, is addressed by Leung et al., who proposed a Neuro-Fuzzy Inference System to forecast order arrivals. Other research emphasizes managing uncertainty in decision-making through hybrid classification models (e.g., Malhotra et al.) and leveraging time series forecasting (Rodrigues & Serra) or swarm intelligence and deep learning (Wang) for customer segmentation.
Clustering remains a central technique across many studies—whether for segmenting customer bases (Kuo et al., France & Ghose), defining trade zones with fuzzy logic, predicting customer churn, or structuring forecast models on regional or global sales data (Savych et al.). These approaches are crucial for building adaptive systems that respond to the nuanced demands of modern markets.
Overall, this broad body of research supports three main conclusions for pharmaceutical online retail management:
This analytical foundation affirms the growing importance of intelligent systems and advanced modeling in managing pharmaceutical e-commerce, making it essential for companies to embrace innovation not only in product offerings but also in operational and strategic execution.
Results
In the evolving landscape of pharmaceutical e-commerce, strategic decision-making increasingly relies on data-informed performance models. One such approach involves applying a managerial control framework to assess operational efficiency and sales dynamics within a hybrid retail environment. The analysis is based on a dataset of 3,672 customer transactions collected from 115 pharmaceutical stores operating on the Ukrainian online reservation platform “Tabletki.ua.” This platform does not execute the full sales cycle online. Instead, it enables customers to reserve products at discounted prices, with final purchases and payments completed at physical pharmacy locations. This offline completion stage introduces unique variables into commercial performance evaluation, particularly when measuring service precision, staff effectiveness, and customer engagement.
The study examines transactional behavior over a three-day period, capturing detailed data on order values, actual sales, processing times, and outcomes. From this, key variables were constructed: the “Value of Request” (total amount reserved), “Value Sold” (actual amount paid), and “Extra Sales” (the difference between ordered and purchased value). Additionally, “Time of Response” was calculated in seconds to reflect the promptness of store-level engagement with customer inquiries. Several binary indicators were also introduced to assess operational quality: “Processing Result” (whether the order was successfully closed), “Commercial Performance” (whether the customer spent more than initially reserved), and “Precise Sales” (indicating whether the order was fulfilled exactly as requested).
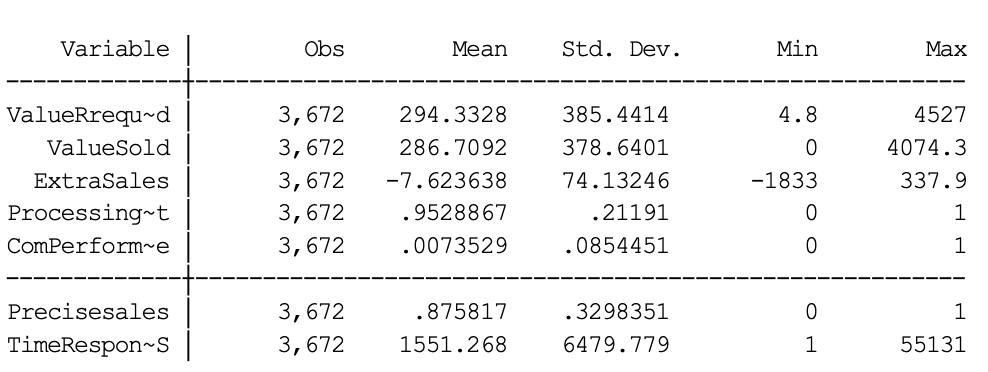
As illustrated in Fig. 1, the descriptive statistics reveal substantial variation within the dataset, which is expected in real-world commercial settings. The average value of customer requests stood at 294.3 UAH, while the average value of completed sales was slightly lower at 286.7 UAH. This shortfall reflects a measurable trend in order discrepancies, possibly linked to pricing inconsistencies or product unavailability. The mean “Extra Sales” value was −7.62 UAH, indicating that in most cases customers spent less than originally intended. However, some transactions showed positive differentials, highlighting upselling opportunities or pricing adjustments. The average time taken to respond to a customer request was approximately 25 minutes, though in some instances delays extended to over 15 hours. Still, 95.3% of all orders were completed successfully, suggesting generally high operational reliability. Moreover, 87.6% of transactions were filled without deviations, while only 0.7% showed signs of commercial over-performance from the store’s side.
These indicators provide a nuanced perspective on pharmacy store operations within a digital-to-physical transaction model. The findings serve as a valuable reference point for executives, platform developers, and analysts seeking to enhance customer experience, fine-tune staff incentives, or reduce friction in online-to-offline retail processes. They also demonstrate the practical value of using statistical and managerial tools to benchmark performance, identify service bottlenecks, and inform data-driven improvements in a competitive market environment.
To uncover meaningful patterns within the operational behavior of pharmaceutical stores, a clustering procedure was applied to the dataset, enabling segmentation of the observations into homogenous groups. Given the size and complexity of the sample, Kohonen Self-Organizing Maps (SOMs) were selected as the primary analytical tool. SOMs offer distinct advantages over traditional clustering algorithms, particularly in visual interpretability and robustness when working with large datasets. Each map’s topology reflects the relative similarity of observations, with those demonstrating extreme feature values occupying opposite areas of the map. This makes SOMs especially valuable in performance benchmarking and identifying outlier behavior—both positive and negative.
The SOM was constructed using Deductor Studio with a configuration of 900 neurons, trained over 1,000 epochs. Initialization was based on internal vector parameters, and a Gaussian neighborhood function was applied with a learning radius of 8.5. Through iterative modeling, five key variables were identified as most influential in determining commercial and operational profiles: Value of Request, Time of Response, Precise Sales, Commercial Performance, and Result of Processing a Request. These indicators provided the clearest distinction between behavioral patterns across the sample.

As visualized in Fig. 2, the resulting seven clusters (panel a) represent distinct profiles of performance. For example, some groups reflect high-value, accurately fulfilled orders with fast response times—an ideal operational pattern—while others indicate slower processing or inconsistent fulfillment. Panel (b), the Sammon projection of the SOM, reveals two broader groups, suggesting the presence of divergent operational strategies or performance paradigms within the market. This structural separation forms the basis for distinguishing between at least two types of commercial policy. One may prioritize volume and speed, while the other emphasizes order precision and upselling. These clusters serve as foundational inputs for predictive modeling and the development of targeted management strategies, enabling pharmacy owners and platform administrators to fine-tune operations based on data-driven insights.

A deeper understanding of customer behavior and staff performance in pharmacy e-commerce can be gained through detailed examination of feature-specific heat maps based on the Kohonen Self-Organizing Map (SOM). These visualizations, presented in Fig. 3, illustrate how key operational indicators distribute across clusters, revealing unique performance patterns and customer engagement dynamics that are otherwise difficult to detect in raw data alone.
The most notable area is the upper-right corner of all maps, corresponding primarily to clusters 1 and 4 from Fig. 2.a. These clusters exhibit high commercial performance (Fig. 3.d), despite having a low score on “Precise Sales” (indicating a mismatch between ordered and sold values). Interestingly, this region includes instances where the order total was below average (as shown in Fig. 3.a), yet in certain cases, pharmacy personnel were able to upsell or convert uncertain buyers into paying customers. This suggests a cluster of stores capable of creating added value even under challenging transaction conditions. Although cluster 4 includes some cases where no purchase occurred (as visible in Fig. 3.e), the presence of successful high-value sales in the same cluster hints at varied yet opportunistic staff strategies.
In contrast, the lower-right section, populated mainly by clusters 0 and 3, demonstrates slower response times (Fig. 3.b) but ends with successful sales outcomes (Fig. 3.e), suggesting a different service approach—possibly one emphasizing follow-up or secondary engagement. These insights support the hypothesis that varying operational strategies exist across clusters, each with differing trade-offs between speed, precision, and eventual transaction success.
Another compelling region lies in the central area of Fig. 3.a, dominated by cluster 5, where average request values are significantly higher—suggesting more expensive pharmaceutical orders. Interestingly, Fig. 3.b shows these stores tend to respond more quickly to high-value requests. However, as Fig. 3.c indicates, the precision of such sales is often compromised, with many transactions finalized under changed conditions. Notably, Fig. 3.d confirms that while commercial performance remains neutral (i.e., no upselling), Fig. 3.e shows that the success rate of these orders is consistently high, revealing a well-executed conversion strategy for premium sales without overburdening customers.
Altogether, these heat maps enrich the understanding of pharmacy retail operations by offering spatial and behavioral dimensions to performance analysis. They support the development of targeted commercial policies—for example, incentivizing upselling in underperforming clusters or streamlining response times where slow service correlates with lost revenue. In competitive and price-sensitive markets like online pharmacy, such granular insight enables data-backed refinement of service delivery and sales strategy.

Another critical aspect of performance in the online-to-offline pharmacy model is response time—how quickly a pharmacy store acknowledges and processes a customer order after it has been submitted through the marketplace platform. Fig. 4 illustrates the variation in response times across different pharmacy stores in the sample. Each vertical bar represents one or more order responses from a specific store, measured in seconds. While the chart does not show all 115 stores in detail due to scale constraints, it reveals striking disparities in operational behavior.
The standard deviation of this indicator, as referenced earlier in Fig. 1, reaches 6,479.78 seconds (approximately 1.8 hours), which highlights the uneven distribution of responsiveness across the sample. However, despite this variability, the average response time remains relatively efficient at 25.85 minutes, underscoring that a significant portion of transactions are processed swiftly. This efficiency is essential in an industry where delays can erode customer trust and influence future purchasing decisions.
The underlying reason for these differences often lies in the internal workflows of each pharmacy store. Field observations and platform insights suggest three dominant approaches to order handling:
These differences are more than procedural—they directly impact customer experience, sales conversion, and ultimately, the commercial viability of each store within the marketplace ecosystem. The performance lag seen in some units suggests opportunities for process optimization through simple interventions such as staff role specialization, automatic alerts for incoming orders, or shift-based distribution of online responsibilities.
In competitive digital retail environments, response time is more than a metric—it is a competitive advantage. Fast, consistent engagement reassures customers and increases the likelihood of successful transactions, particularly in price-sensitive or health-critical product segments. As platforms like “Tabletki.ua” continue to grow, standardized expectations around speed and service will become even more integral to maintaining customer loyalty and maximizing store performance.

The analysis presented in Fig. 5 reveals a clear link between response time and the value of both requested and sold pharmaceutical products. Fast responses tend to correlate with higher-value orders, suggesting that pharmacies prioritize more profitable transactions—either through automated system alerts or more attentive workflows. Two main processing patterns emerge: one where orders are handled quickly, often by designated staff (linked to clusters 2, 5, 6), and another where response times stretch up to 11 hours, typically in stores without a clear order-handling process (clusters 0, 3, and partly 1 and 4). These differences highlight how internal organization directly affects commercial performance and customer satisfaction.

As shown in Fig. 6, most customers complete purchases exactly as ordered via the marketplace, with no price differences—indicated by the dense vertical cluster at zero on the x-axis. Only 12.45% of transactions show discrepancies, concentrated in clusters 1 and 4 of the SOM. These discrepancies are typically negative, where customers either reject the order entirely or reduce its value during pickup, shown by points on or above the downward slope in the left quadrant. In contrast, positive differences—where customers buy more than initially ordered—are rare and located on the far right of the chart. These findings suggest that order rejection or downgrading is a more common issue than upselling in the current marketplace model, underlining potential friction in price transparency or stock availability at the point of sale.
As confirmed by the strong correlation visualized in Fig. 7, the values of requested and sold pharmaceutical products align closely, validating the reliability of sold value as the central performance metric. To model and forecast this key indicator, a neural network was developed using a perceptron architecture (Fig. 8), leveraging variables such as order value, processing outcomes, and time of response. Trained with the Resilient Propagation algorithm, the model demonstrates high predictive accuracy. This is evident from the scatter plots in Fig. 9, where predicted values closely track actual sales for both the training and test samples. The consistency of results within tight confidence intervals—particularly the model’s strong performance on test data—demonstrates its potential as a practical forecasting tool for supporting operational decisions and revenue optimization in online pharma retail.


Conclusion
Digitization of economic subsystems and the intensive development of omnichannel commerce are among the most powerful drivers of economic growth. The progress of technology and the improvement of pharmaceutical industry distribution channels are a priority of the state policy in most countries to enhance the welfare and quality of life of the population. To identify promising directions and levers for increasing the efficiency of Ukrainian pharmaceutical online retail enterprises, the authors of the article used a set of neural network and statistical analytical tools, which have been tested on a dataset of over a hundred pharmacy stores. First of all, it was carried out clustering using the Kohonen self-organizing maps tool, which made it possible to identify patterns in the behaviour of customers and pharmacy staff in the process of fulfilling orders for pharmaceutical products. A study of the clustering results, supported by statistical analysis, showed that the speed of request execution is always high when the order price is high. In other cases, the order will most likely be processed either within a couple of hours or within 6 to 11 hours. And the article explains that this will depend on the order-placement procedure (how the order processing is set up in each individual pharmacy). A neural network model of the perceptron type was also built to predict the value of sold products as the final result of each commercial operation in the pharmacy. Evaluation of the accuracy of forecasting results based on the developed neural network model using a scatter diagram confirmed its high efficiency. As a further development of this study, we envision optimizing the actions of pharmacy staff in the process of performing the order-placement procedure in terms of processing orders and the work of staff to increase the purchase receipt, which should lead to increased productivity of the pharmaceutical business.
References
- Zhang, X., Edwards, J., & Harding, J. (2007). Personalised online sales using web usage data mining. Computers in Industry, 58(8–9), 772-782. https://doi.org/10.1016/j.compind.2007.02.004
- Bradlow, E. T., Gangwar, M., Kopalle, P., & Voleti, S. (2017). The Role of Big Data and Predictive Analytics in Retailing. Journal of Retailing, 93(1), 79-95. https://doi.org/10.1016/j.jretai.2016.12.004
- Sulthana, A. R., & Ramasamy, S. (2019). Ontology and context based recommendation system using Neuro-Fuzzy Classification. Computers & Electrical Engineering, 74, 498-510. https://doi.org/10.1016/j.compeleceng.2018.01.034
- Nilashi, M., Abumalloh, R. A., Samad, S., Minaei-Bidgoli, B., Thi, H. H., Alghamdi, O. A., Ismail, M. Y,. & Ahmadi, H. (2023). The impact of multi-criteria ratings in social networking sites on the performance of online recommendation agents. Telematics and Informatics, 76, Article 101919. https://doi.org/10.1016/j.tele.2022.101919
- Liao, Sh.-H., Chen, Ch.-M., & Wu, Ch.-H. (2008). Mining customer knowledge for product line and brand extension in retailing. Expert Systems with Applications, 34(3), 1763-1776. https://doi.org/10.1016/j.eswa.2007.01.036
- Voronenko, I., Nehrey, M., Kostenko, S., Lashchyk, I., & Niziaieva, V. (2021). Advertising Strategy Management in Internet Marketing. Journal of Information Technology Management, 13(Special Issue: Advanced Innovation Topics in Business and Management), 35-47. https://doi.org/10.22059/jitm.2021.82603
- Leung, K.H., Choy, K.L., Ho, G.T.S., Lee Carman, K.M., Lam, H.Y., & Luk, C.C. (2019). Prediction of B2C e-commerce order arrival using hybrid autoregressive-adaptive neuro-fuzzy inference system (AR-ANFIS) for managing fluctuation of throughput in e-fulfilment centres. Expert Systems with Applications, 134, 304-324. https://doi.org/10.1016/j.eswa.2019.05.027
- Malhotra, M. K., Sharma, S., & Nair, S. S. (1999). Decision making using multiple models. European Journal of Operational Research, 114(1), 1-14. https://doi.org/10.1016/S0377-2217(98)00037-X
- Rodrigues, S. E., & Serra, G. L.O. (2022). An approach for evolving neuro-fuzzy forecasting of time series based on parallel recursive singular spectrum analysis. Fuzzy Sets and Systems, 443(B), 1-29. https://doi.org/10.1016/j.fss.2021.09.009
- Wang, Ch. (2022). Efficient customer segmentation in digital marketing using deep learning with swarm intelligence approach. Information Processing & Management, 59(6), Article 103085. https://doi.org/10.1016/j.ipm.2022.103085
- Kuo, R.J., An, Y.L., Wang, H.S., & Chung, W.J. (2006). Integration of self-organizing feature maps neural network and genetic K-means algorithm for market segmentation. Expert Systems with Applications, 30(2), 313-324. https://doi.org/10.1016/j.eswa.2005.07.036
- Tarasova, L., & Piskunova, O. (2015). Modeli podilu rynku na torhovi zony v nechitkykh umovakh [Models of market division into trade areas in the fuzzy conditions]. Neiro-Nechitki Tekhnolohii Modelyuvannya v Ekonomitsi (Neuro-Fuzzy Modeling Techniques in Economics), 4, 189-217. http://doi.org/10.33111/nfmte.2015.189 [in Ukrainian]
- Mazur, H., Burkina, N., Popovskyi, Y., Vasylenko, N., Zaiachkovskyi, V., Lavrov, R., & Kozlovskyi, S. (2023). Customer Classification and Decision Making in the Digital Economy based on Scoring Models. WSEAS Transactions on Business and Economics, 20, 800-814. https://doi.org/10.37394/23207.2023.20.74
- Savych, O., Molchanova, E., Fedorchenko, A., & Kovtoniuk, K. (2021). Modeling of Key Marketing Parameters of Development of the EU Car Market and its Clusterization. In Proceedings of 2021 11th International Conference on Advanced Computer Information Technologies (ACIT) (pp. 364-367). IEEE. https://doi.org/10.1109/ACIT52158.2021.9548474
- France, S. L., & Ghose, S. (2019). Marketing analytics: Methods, practice, implementation, and links to other fields. Expert Systems with Applications, 119, 456-475. https://doi.org/10.1016/j.eswa.2018.11.002
- Turlakova, S. (2022). Modeling the values of reflexive characteristics of agents within the management of herd behavior at the enterprises. Neuro-Fuzzy Modeling Techniques in Economics, 11, 48-77. http://doi.org/10.33111/nfmte.2022.048
- Statistics Service of Ukrainian pharmaceutical marketplace «Tabletki.ua». (2022). Customers’ orders placed and proceed via the online web-integrated application [Data set]. Retrieved July 1, 2022, from https://tabletki.ua/
- Lukianenko, D., Matviychuk, A., Lukianenko, L., & Dvornyk, I. (2023). University competitiveness in the knowledge economy: a Kohonen map approach. CEUR Workshop Proceedings, 3465, 236–250. https://ceur-ws.org/Vol-3465/paper23.pdf
- Velykoivanenko, H., Korchynskyi, V., & Chernyshova, V. (2016). Doslidzhennia efektu perenavchannia neironnykh merezh na prykladi zadachi aplikatsiinoho skorynhu [Study of the neural networks overfitting effect on the example of the problem of application scoring]. Neiro-Nechitki Tekhnolohii Modelyuvannya v Ekonomitsi (Neuro-Fuzzy Modeling Techniques in Economics), 5, 3-23. http://doi.org/10.33111/nfmte.2016.003 [in Ukrainian]
- Sharma, A., Randhawa, P., & Alharbi, H. F. (2022). Statistical and Machine Learning Approaches to Predict the Next Purchase Date: A Review. In Proceedings of 2022 4th International Conference on Applied Automation and Industrial Diagnostics (ICAAID) (pp. 1-7). IEEE. http://doi.org/10.1109/ICAAID51067.2022.9799494


Tell us about your project needs


.png)