


The table of content
This article is a summary of the scientific work published by Andrii Bielinskyi, Vladimir Soloviev, Serhiy Semerikov, Viktoria Solovieva
The original source can be accessed via DOI 10.33111/nfmte.2021.003
Cracking the Code of Market Complexity
Financial markets aren’t just unpredictable — they’re downright wild. Behind every chart, price spike, or crash lies a complex web of agents (humans, algorithms, institutions) all making decisions, reacting to news, and influencing each other in ways that defy linear logic. Traditional models can’t keep up — they’re built for tidy systems, not today’s fast-moving, ever-evolving markets.
But here’s the good news: modern analytics can. By tapping into nonlinear dynamics and complexity science, researchers and innovators have begun to uncover hidden patterns in stock market data — patterns that can act as early warning signs before things spiral. Think of them as the “canaries in the coal mine” for crashes and volatility.
One of the most powerful tools in this space? Entropy analysis — a method for measuring how “unpredictable” a system has become. And thanks to innovations like fuzzy entropy and permutation entropy, we can now do this even when data is noisy or limited. These tools go far beyond basic stats — they capture subtle shifts in the system’s behavior before traditional indicators even flinch.
Another game-changer? Recurrence plots. Originally a physics tool, they’ve found their way into finance as a way to visualize and quantify chaos in time series data. When enhanced with fuzzy logic and smart clustering techniques, they become even more powerful — turning messy data into clear signals.
In our recent work, we applied these advanced methods to one of the most iconic indexes in finance: the Dow Jones Industrial Average. By analyzing four major crash periods, we tracked how complexity levels spiked in the lead-up to each event. The result? A powerful framework for detecting market turbulence in real time — one that can help not just traders, but policymakers and strategic investors make more confident, informed decisions.
If you're relying only on traditional indicators, you’re flying blind. Complexity metrics are the next frontier in financial foresight — and they’re already changing the game.
How We Uncover the Signals Behind the Storm
To decode the DNA of market crashes, we zoomed in on four of the most turbulent years in financial history: 1929, 1987, 2008, and 2020. Using daily data from the Dow Jones Industrial Average (DJIA), we focused on how the market behaved right before things fell apart. Our goal? Spotting early signs of chaos using advanced complexity indicators.
At the heart of this analysis is a simple but powerful idea: when a market crash is approaching, the behavior of returns becomes anything but normal. So, instead of just looking at raw numbers, we transformed the data using standardized returns — capturing how far a given signal deviates from the norm.
Next, we brought in the big guns: entropy-based methods. Think of these like digital thermometers for the market’s stability — tools that measure unpredictability and disorder in price movements. Our experiments showed:
- Shannon, Approximate, and Fuzzy Entropy were best at analyzing standardized returns.
- Permutation Entropy and its fuzzy upgrade excelled at catching signals in raw, unprocessed data.
- Recurrence Plots (both classic and fuzzy) gave the clearest visuals of market rhythm before crashes.
Why fuzzy logic? Because real-world markets aren’t black and white — they’re messy, noisy, and full of borderline cases. Fuzzy membership functions let us work with that ambiguity, modeling shifts with more grace and less error, especially on short time series where traditional tools struggle.
We used Python and Jupyter Notebooks to build a fully reproducible environment — no black boxes here. The entire workflow was based on open-source packages and is available for anyone curious enough to dive deeper.
To fine-tune our fuzzy tools, we tested different settings (like how sharp or soft the "boundaries" between market states should be). We found that certain parameter combinations delivered stable and insightful results across multiple entropy types — exponential, sigmoid, and linear.
But we didn’t stop at snapshots. We applied a sliding window approach — slicing the data into overlapping chunks (250-day windows), each shifted slightly over time. This helped us watch how the market’s complexity evolved leading up to each crash. Think of it as slow-motion footage of chaos forming.
Here’s the punchline: when we compared these complexity patterns across all four crashes, we saw a clear trend. Complexity didn’t rise randomly — it followed a consistent path. In many cases, it spiked or dropped right before things got bad.
That’s the power of these tools: they don’t just explain the past. They can help predict the future.
Shannon Entropy: Measuring Market Surprise
At the core of information theory lies a simple but powerful question: how much can we learn from a market signal? That’s exactly what Shannon entropy was built to answer.
Originally developed by Claude Shannon — the father of modern information theory — this method measures the average amount of "surprise" in a set of outcomes. In finance, that translates to: how predictable (or unpredictable) are market returns?
Here’s the logic: when prices move in unpredictable ways, entropy is high. But when markets behave in more repetitive or expected ways — like during a crash when panic-selling dominates — entropy drops.
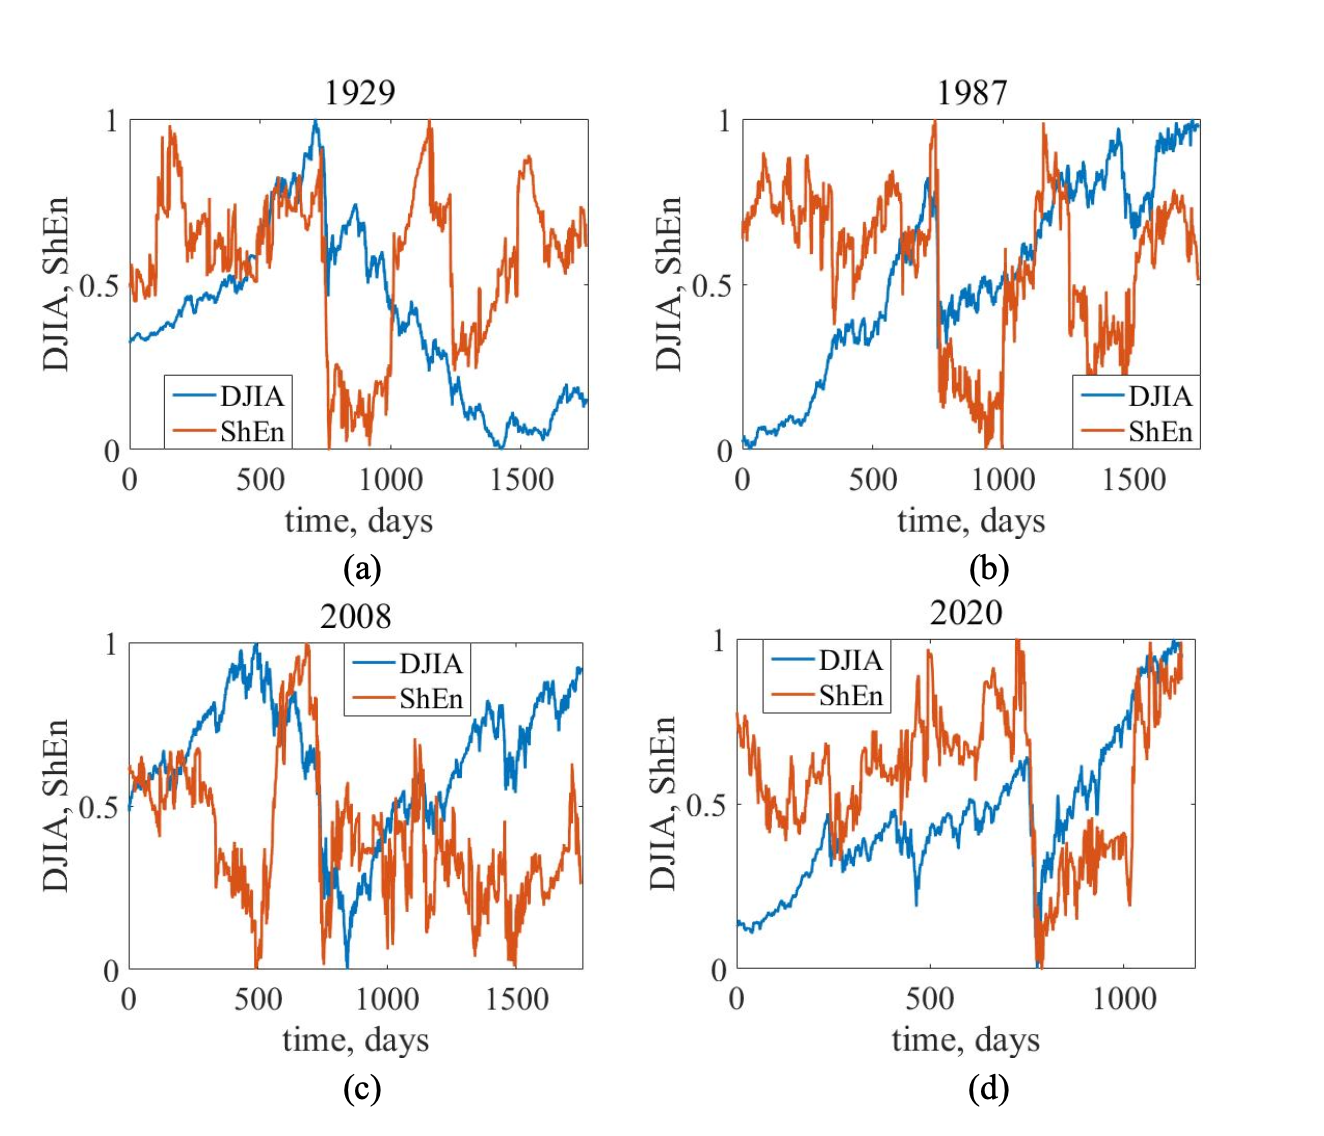
We applied Shannon entropy (ShEn) to the DJIA across four iconic crash periods: 1929, 1987, 2008, and 2020. The idea was to track how “surprise levels” changed as markets approached collapse.
What we saw:
During each crash, entropy fell sharply. That drop signals a critical insight: returns became more concentrated and predictable, likely driven by herd behavior and emotion-driven trades. In other words, a smaller number of return types started dominating — a classic precursor to systemic stress.
This matters for investors and analysts alike: a drop in entropy could be a red flag, suggesting that the market is losing its diversity of behavior — a sign that something big might be brewing.
Making Sense of Market Ambiguity with Fuzzy Shannon Entropy
Real-world markets aren’t black and white. They're full of noise, ambiguity, and blurred boundaries — which is exactly where Fuzzy Shannon Entropy (FuzzShEn) shines.
Unlike classic Shannon entropy, which treats outcomes as purely probabilistic (either it happens or it doesn’t), FuzzShEn introduces a more flexible view. It evaluates degrees of membership — essentially asking: how strongly does this market behavior fit a certain pattern? This shift allows us to handle uncertainty in a much more realistic, dynamic way.
We tested two foundational approaches to FuzzShEn:
- Zadeh’s model, which weighs uncertainty using fuzzy logic directly.
- De Luca and Termini’s model, which adds refinements to handle overlap and imprecision in a more mathematically consistent way.
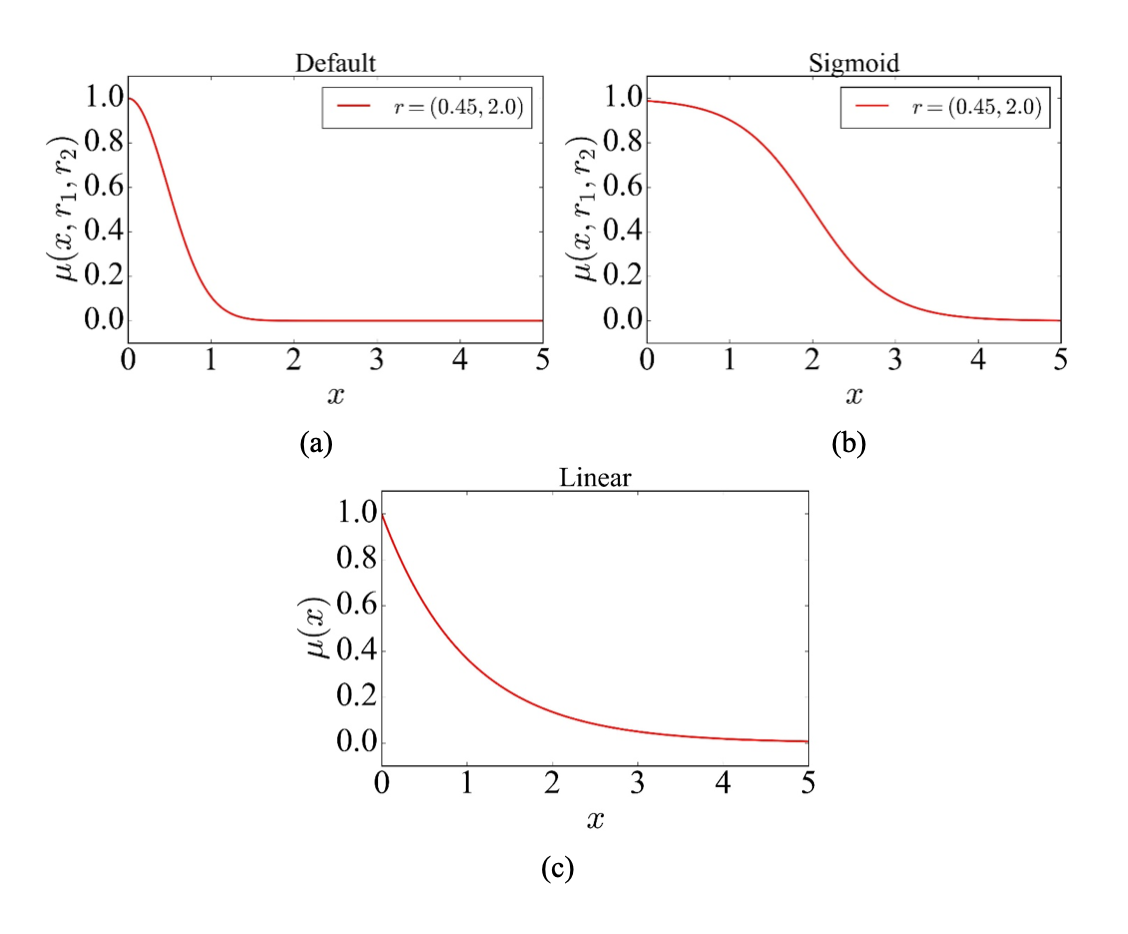
Both approaches were combined with different membership functions — exponential, sigmoid, and linear — each bringing its own strengths. Exponential functions offer smooth decay, sigmoid functions capture nonlinear shifts well, and linear ones react sharply to change.
So, what did we learn?
- Zadeh’s model with exponential membership showed entropy drops after a crash, meaning it reflects chaos well — but it lags behind it.
- Switching to the sigmoid function produced more symmetric, timely responses, making it a better fit for early warning systems.
- De Luca’s model, especially when paired with the sigmoid function, proved to be the most consistent — showing reliable entropy declines across all four market crashes we studied (1929, 1987, 2008, 2020).
- The linear membership function provided sharper signals but at the cost of smoothness. It’s more sensitive, but more reactive than predictive.
While FuzzShEn isn’t always a crystal ball, it acts as a robust indicator of when the market is transitioning into a more deterministic, risk-driven state. It smooths out noise, highlights meaningful shifts, and gives analysts, traders, and policymakers a clearer view of systemic stress — all without overfitting or overreacting to minor fluctuations.
In short, fuzzy entropy transforms raw chaos into readable signals — giving decision-makers a smarter way to watch uncertainty unfold.
How Stable Is “Normal”? Measuring Market Irregularity with Approximate Entropy
Markets constantly fluctuate — but not all fluctuations are equal. Approximate Entropy (ApEn) gives us a way to measure how predictable or irregular those movements really are.
The idea behind ApEn is simple but powerful: if a market pattern shows up in one part of the data, how likely is it to repeat elsewhere? If that likelihood is high, the system is considered more regular (and ApEn is low). If patterns are short-lived and chaotic, ApEn increases, signaling more complexity and less predictability.
To apply ApEn, we reconstruct a higher-dimensional version of the time series using a mathematical framework called phase space embedding. Then we assess how closely different trajectories in this space resemble each other, using a similarity threshold. In our setup, we found a threshold of r = 0.45 gave reliable insights during crisis periods.
Here’s what ApEn showed us: during stable market phases, entropy stays relatively low, indicating repeatable behavior. But as markets approach a crash, patterns become more erratic — and ApEn values rise accordingly.
It’s worth noting that ApEn has some limitations. It can be sensitive to the length of the time series and sometimes biased due to its mathematical structure. That’s where fuzzy enhancements come in (we explore those later). But even in its classic form, ApEn proves valuable for monitoring shifts in regularity.
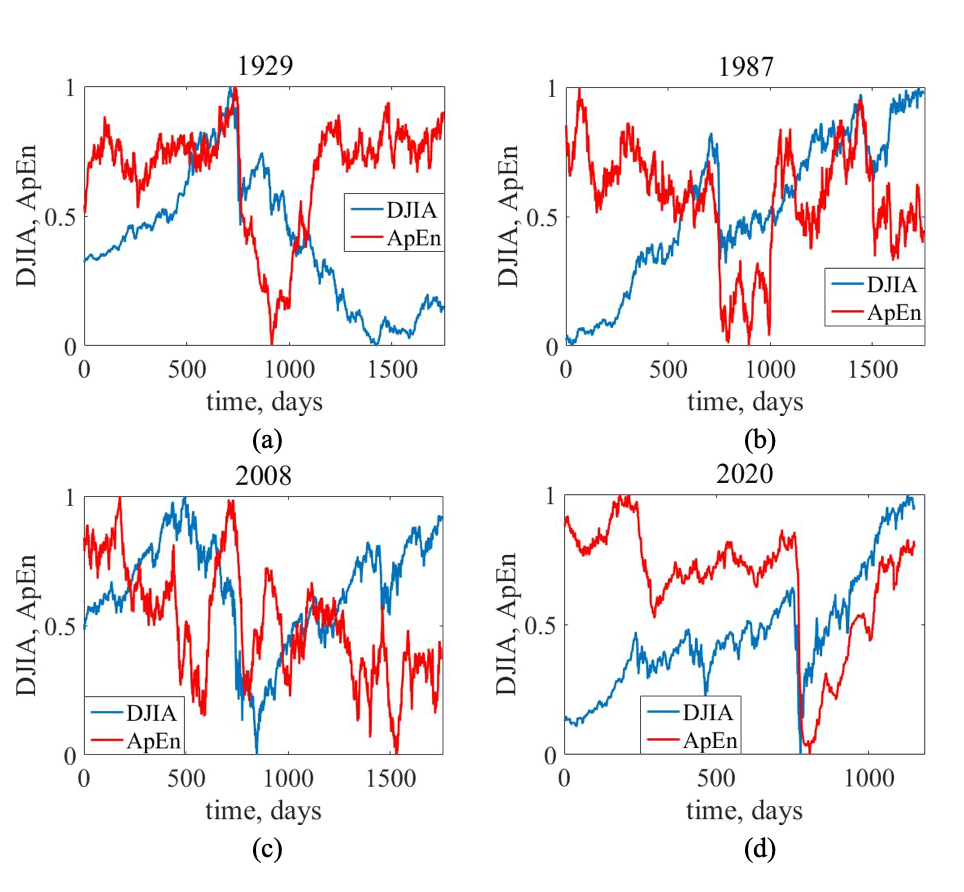
We applied this method to key market crashes (1929, 1987, 2008, and 2020), and the results were consistent: as market conditions worsened, ApEn dropped, reflecting increased short-term predictability due to crowd-driven behavior. This aligns closely with what we saw using Shannon entropy — confirmation from two distinct complexity lenses.
Adding Intelligence to Irregularity: Fuzzy Approximate Entropy
Classic Approximate Entropy (ApEn) is powerful — but not perfect. It’s sensitive to short signal lengths, uses a binary decision function, and can misfire in noisy data. That’s where Fuzzy Approximate Entropy (FuzzApEn) comes in — a smarter, more flexible tool built for real-world complexity.
Instead of simply labeling two patterns as “similar” or “not,” FuzzApEn evaluates how similar they are — assigning a value between 0 and 1 using a fuzzy membership function. This allows us to detect partial similarity, smoothing out noise and capturing more nuanced dynamics in time series data.
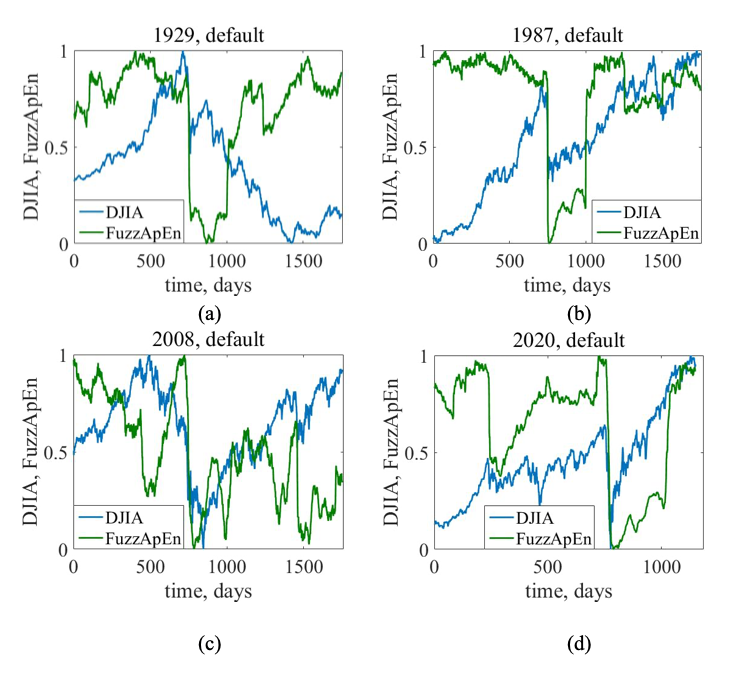
When we applied the exponential version of FuzzApEn to major stock market crashes (1929, 1987, 2008, 2020), we found a strong and consistent signal: entropy dropped significantly as the market approached crisis. Compared to classic ApEn, FuzzApEn showed:
- Better localization of the critical period (less lag)
- More robustness to signal length
- Lower sensitivity to tuning parameters (r₁ and r₂)
In short, it’s a more reliable early indicator — especially when paired with a well-chosen membership function.
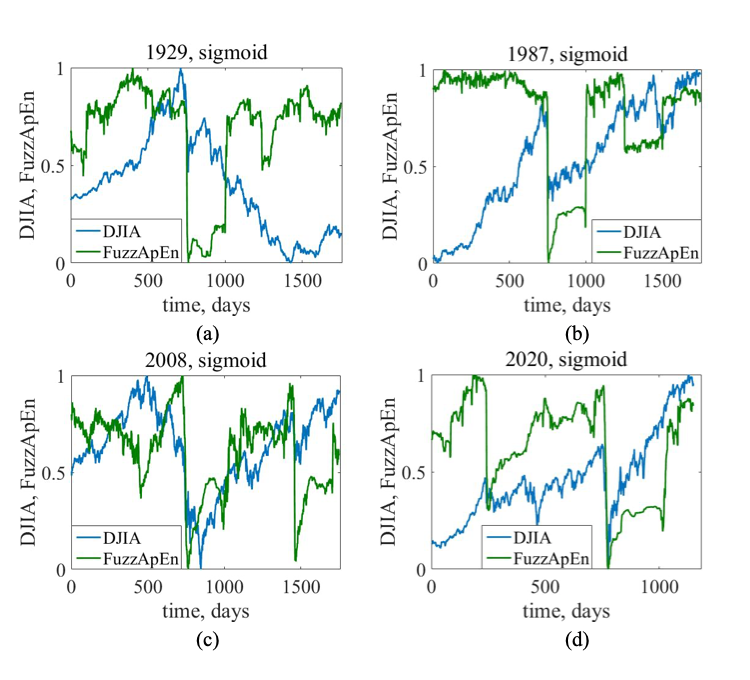
We also tested a sigmoid-based fuzzy membership function, which smoothed the transitions even further. The results were nearly identical to the exponential setup — with clean declines in entropy right before or during each crash. This suggests the sigmoid version is just as valid — and may be preferable for certain financial applications due to its gentle slope.

Finally, we ran FuzzApEn using a linear function. While this method caught early warning signs in 1929 and 1987, the signal for the 2008 crisis was noisier and less predictive. The entropy drop still occurred — but the timing and shape were less sharp, suggesting this version may be less effective for detecting some types of volatility.
Why It Matters for Markets
FuzzApEn is more than just a mathematical upgrade — it’s a practical tool for identifying looming instability. By tracking how much market behavior “repeats itself” over time, and how sharply that predictability drops, we can:
- Spot signs of crowd-driven behavior
- Detect periods of increasing determinism (e.g., panic selling)
- Support traders, analysts, and regulators with better timing around critical events
And because it’s less sensitive to noise and data length, FuzzApEn is especially useful in real-time monitoring, where speed and clarity matter most.
Spotting Predictable Patterns Before They Break: Permutation Entropy
When markets start moving in ways that feel “too familiar,” something may be brewing beneath the surface. Permutation Entropy (PEn) is designed to catch that moment — by measuring how ordered or disordered the price movements are, based on the sequence of their values.
Instead of focusing on raw prices, PEn looks at the order of values — that is, how prices are arranged over time. Is the market following a clean upward trajectory? Bouncing around unpredictably? Flattening out? These patterns, or permutations, tell us how structured the market behavior is — and whether it’s getting dangerously uniform.
To calculate this, we transform the time series into short overlapping segments and examine their ordinal patterns. For example, if a pattern consistently follows the form [low, medium, high], that suggests increasing order — and possibly, a buildup toward a critical point. The more frequently a single pattern appears, the lower the entropy — signaling the market is behaving in a more deterministic way.
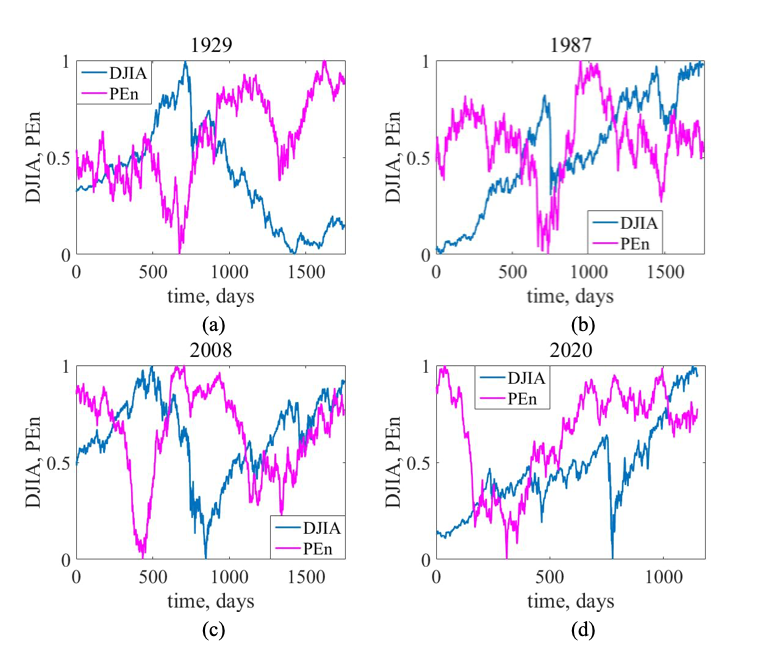
Here’s what the results showed: Permutation Entropy dropped well before each major crash — particularly in the lead-up to 2008. This suggests the market became “too regular” just before breaking. In other words, crowd-driven behavior made movements more predictable… right before everything flipped.
Compared to other entropy measures, PEn is highly sensitive to early signals. When the same type of pattern dominates — like a repeated upward push (e.g., permutation {0, 1, 2}) — the entropy score falls. That drop becomes a red flag: the market is losing complexity, and something is about to give.
Fuzzy Permutation Entropy: Precision in Pattern Recognition
Permutation entropy (PEn) is already a sharp tool for detecting market regularities — but it gets even better when you make it fuzzy. Fuzzy Permutation Entropy (FuzzPEn) builds on PEn by adding flexibility, allowing it to better handle noise and partial similarity between market patterns.
Instead of just counting how often ordinal patterns repeat, FuzzPEn goes deeper — it calculates how similar those patterns are, using a fuzzy similarity score. The closer two sequences are (based on the number of swaps required to match them), the more influence they have in the entropy calculation.
Here’s how it works:
- Patterns are compared using swap-based distances.
- Those distances are standardized and fuzzified, meaning they’re mapped to a similarity scale from 0 to 1.
- Entropy is then calculated based on averaged similarity, not just rigid repetition.
This makes FuzzPEn ideal for systems like financial markets, where near-repetitions often carry meaningful signals — even if they’re not identical.
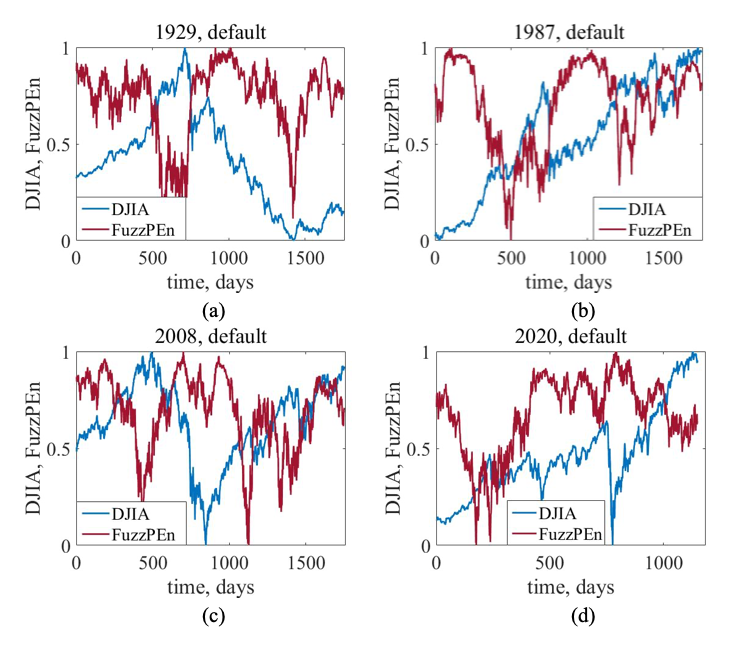
When we applied FuzzPEn to four major crashes — 1929, 1987, 2008, and 2020 — using the default exponential function, the results were clear: entropy declined sharply before each collapse, flagging increased predictability and crowd-like behavior. Compared to the classic PEn, this fuzzy version gave us stronger and cleaner early warnings.

Switching to a sigmoid membership function, we observed similar results. Across all crashes, entropy dipped just before or during the event. This suggests that fuzzy enhancements not only retain the benefits of PEn — they enhance its sensitivity.
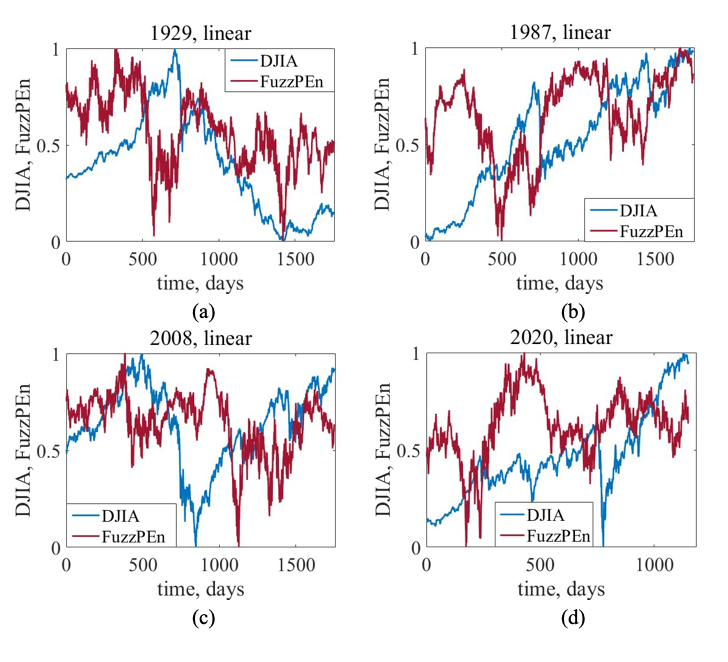
Even with a linear function, FuzzPEn performed well. The indicator consistently dropped before or during market collapses. While the exact timing and magnitude varied slightly across membership types, the overall signal stayed consistent — suggesting that FuzzPEn is robust across modeling choices.
What This Means in Practice
FuzzPEn is a valuable upgrade for anyone needing early insight into market shifts. Whether you're building an AI-driven trading platform, monitoring systemic risk, or enhancing portfolio resilience, this method helps detect when the market is becoming too predictable — and therefore vulnerable.
And here’s the key takeaway: no matter which fuzzy membership function you choose, the core behavior of FuzzPEn stays reliable. That makes it a strong candidate for integration into real-time monitoring systems — adaptable, sensitive, and resilient under pressure.
Recurrence plot and its fuzzified version
A classic recurrence plot (RP) represents how similar or dissimilar different states of a system are over time. Given a set of phase states, each representing a point in a reconstructed phase space, we define the RP as a binary matrix indicating whether pairs of states are close enough to each other. If a state remains within a ball of radius ε from another, we place a value of 1 in the matrix; otherwise, 0. This is formalized by using the Heaviside function applied to the difference between phase vectors.
For our calculations, we set the embedding dimension and delay to 1. Euclidean distance is used to determine the closeness between trajectories, and the threshold ε is 0.1. Various visual patterns emerge in recurrence plots depending on the underlying system's behavior. Isolated points typically indicate rare events or state changes. Horizontal or vertical lines suggest the system is stationary, while diagonal lines show recurrence of similar states over time. Longer diagonal lines are expected in deterministic systems, while stochastic systems tend to produce more isolated points and shorter lines.
The visual structure of recurrence plots varies across different time series, even if they all reflect the same type of event (e.g., market crashes). Each crash presents a unique pattern, confirming that linear methods might be insufficient to capture their underlying dynamics. Instead, recurrence plots, though sensitive to parameters like embedding dimension and threshold, provide a clearer insight into the system’s behavior.
Fuzzy recurrence plots (FRPs) extend the classic approach by replacing binary similarity with a degree of similarity ranging from 0 to 1. This helps alleviate sensitivity to the chosen threshold and offers more detailed insights into the system’s state transitions.
The fuzzy approach introduces fuzzy clusters of states and a fuzzy matrix that expresses the degree of membership of each point in each cluster. Using fuzzy c-means clustering, the goal is to minimize an objective function that takes into account the weighted distances between points and cluster centers. The algorithm iteratively updates the membership values until convergence.
In this approach, each trajectory is assigned a coefficient reflecting its belonging to a fuzzy cluster. The center of each cluster is computed as a weighted average of all trajectories, where the weights depend on the membership degrees. Membership values are updated based on the distance between trajectories and centers, ensuring convergence within a small error threshold.
Fuzzy recurrence plots reveal a denser and more structured view of the system’s dynamics. Compared to classic recurrence plots, FRPs reduce the presence of isolated points and provide a richer depiction of how the system evolves. This enhanced representation makes fuzzy recurrence plots a more informative tool for analyzing critical transitions and recurrent behaviors in complex systems.
Conclusions: Turning Uncertainty Into Insight
This study marks a new step in making sense of complex systems—especially financial markets—by blending fuzzy logic with advanced analytics. While fuzzy logic has long been known for handling uncertainty and nuance, its potential is far from tapped out. As it intersects with fields like chaos theory, information theory, and complex networks, its relevance will only grow.
We’ve introduced and benchmarked a new generation of early-warning indicators built on fuzzy entropy and fuzzy recurrence plots. These tools were tested against four of the most significant financial crashes in modern history—1929, 1987, 2008, and 2020—using Dow Jones Industrial Average data as our baseline.
Our comparative analysis shows a clear edge for fuzzy logic. Fuzzified versions of entropy (Shannon, approximate, and permutation) consistently outperformed their classical counterparts, proving more resilient to changes in parameters like time window size, embedding dimensions, and delay settings. Among the fuzzy membership functions tested, the sigmoid function emerged as the most reliable and effective across use cases—especially when building predictive tools or trading strategies.
Fuzzy recurrence plots showed similar advantages. While they captured the same events as classical methods, their structure was denser, richer, and visually more informative. With the help of fuzzy clustering, we uncovered finer-grained patterns in market dynamics that traditional approaches often miss.
What’s next? There’s strong potential in expanding this approach further—into fuzzy cross-recurrence plots, fuzzy recurrence networks, and integration with deep learning models. These could unlock even more accurate and interpretable forecasting tools.
For investors, analysts, and financial institutions, the implications are practical and immediate. These fuzzy-based methods can power smarter trading strategies, support portfolio optimization, and even inform risk management or regulatory planning.
In short, fuzzy logic isn’t just an academic curiosity. It’s a flexible, powerful toolkit for making better decisions in a complex, uncertain world.


Recent Insights


Tell us about your project needs


.png)