


The table of content
Introduction
Food security has been a global concern since the 1970s. The term first appeared during the World Food Conference in Rome in 1974, and the following year, the International Food Policy Research Institute was founded in Washington. Over time, the conversation evolved. In the 1980s, Nobel Prize-winning economist Amartya Sen reframed the issue, emphasizing that food security depends not only on food availability, but also on people's ability to access it — through income, market conditions, and social support like transfers or gifts.
Later, theorists like H. Friedman and P. McMichael developed the food regime theory, which connects global food systems to economic power cycles. This approach explains why food and agriculture are not just local concerns, but key elements of global strategies.
Today, organizations like the Food and Agriculture Organization (FAO), the Committee on World Food Security, and the International Finance Corporation define food security as the ability of countries to reliably supply their populations with essential food — both in quantity and quality — using local resources and income.
In 1996, the concept of food sovereignty was introduced by the global farmers' movement Via Campesina. Unlike the more market-driven idea of food security, food sovereignty focuses on local control, environmental sustainability, and fair trade. It pushes back against large-scale industrial food systems and promotes regional alternatives based on ethical, social, and ecological principles.
By the early 2000s, food security research had shifted in three key ways, according to S. Maxwell:
- From a global/national lens to a household/individual focus
- From just food supply to broader livelihood strategies
- From purely objective indicators to include people’s lived experiences and perceptions
Food Security in Practice: Policies and Pressures
When looking at food security worldwide, it's important to consider national agricultural policies. The success of a country’s agricultural sector depends not just on its technology or natural resources, but also on how much financial and administrative support farmers and exporters receive.
According to OECD experts, protectionist policies in agriculture are four times more common than in other industries. This high level of state involvement shows how seriously governments take the issue — not just to ensure food supply, but also to boost rural economies, create jobs, and manage social challenges.
Ye. Novikov suggested a useful way to group countries based on how they approach food security. This framework helps in understanding how different policies are shaped depending on local priorities.
The EU Approach: Balancing Policy, Trade, and Sovereignty
Food security is a top priority for the European Union. A major part of the EU’s agricultural strategy focuses on building a common market where food products can move freely between member states. However, differences in safety and veterinary standards have often created trade barriers, despite the intention of a unified market.
Today, the EU's food sovereignty model favors small farms, discourages mass industrial production, and promotes high-quality, locally sourced food. It also seeks to reduce regional trade imbalances caused by uneven agricultural development. One of the EU’s key strategies has been the adoption of the bioeconomy — a model that combines sustainability, innovation, and economic growth. This approach first emerged in Germany and has since been adopted across Europe.
The Common Agricultural Policy (CAP), which dates back to 1957, remains a cornerstone of the EU’s approach. Its original goal was to reduce dependence on imports and ensure food self-sufficiency. This has worked: by 2010, the EU had become the world’s second-largest food exporter, just behind the U.S. CAP still plays a major role in shaping food security outcomes across the bloc.
Modern Challenges and Tools for Food Security
Global challenges such as demographic shifts and rising inequality are making it harder for both rich and poor nations to respond to food crises. These pressures affect living standards and require smarter, faster solutions.
To better understand and manage food security, researchers have applied a wide range of mathematical and statistical models. For example:
- Some studies use agricultural macro-models to forecast future trends and guide policy.
- Stochastic analysis and risk management tools help deal with uncertainties in farming and food supply.
- The COVID-19 pandemic exposed major vulnerabilities in agricultural systems but also opened doors for digital innovation, particularly in countries like Ukraine.
At the household level, both machine learning and econometric models have been used to predict food insecurity, often based on calorie intake or consumption patterns. While both approaches showed similar levels of accuracy (around 60–70%), their success depends heavily on the quality of data and the complexity of relationships between variables.
One innovative study used shared food behavior — how people share or receive food — as a predictor of deprivation. Machine learning helped uncover patterns that traditional methods might miss, offering new ways to target support.
Another study focused on Ukraine’s agricultural security. It proposed a multi-layered model that included data analysis, regulatory checks, risk control, and performance monitoring. Indicators like GDP and agricultural labor productivity were used to measure economic resilience.
Opportunity for Innovation: A New Clustering Approach
So far, no one has created a machine learning model that clusters countries based on their food security profiles and offers tailored policy recommendations. This opens up a chance to design a new framework using data from international sources like the World Bank, WTO, Eurostat, and FAO.
The goal of the research was to use clustering algorithms to group EU countries based on their food security levels and propose specific strategies that fit the unique situation of each group.
The research includes:
- An overview of literature and the goal of the study
- Methodology used
- Clustering process
- Selection of indicators
- Results interpretation
- Policy recommendations and conclusions
Research Methodology
To assess food security levels across European Union countries, the study used cluster analysis to divide them into groups of countries that share similar characteristics. The aim was to make sure that countries within each group are alike in terms of their food security indicators, while the groups themselves differ significantly from one another. The clearer the distinctions between these clusters, the more effective the resulting policy recommendations become.
The quality of clustering depends heavily on how similarity or difference is measured between countries. Each country is described using several indicators, which places it in a multi-dimensional space. The distance between countries in this space reflects how similar or different they are. To calculate these distances accurately, a specific mathematical function known as a distance metric is used.
In this study, the quadratic Euclidean distance was chosen. This is one of the most widely used distance measures in multi-dimensional analysis. It works by squaring the differences between values for each indicator and summing them up. This helps to highlight countries that differ significantly in one or more areas. The method doesn’t take into account whether values are positive or negative—it focuses only on the size of the difference, which makes it effective at identifying outliers and reinforcing cluster boundaries.
This distance metric also meets several important mathematical conditions: the distance is always zero when comparing a country to itself, always nonnegative in all other cases, and consistent when new reference points are introduced. These properties make it reliable and well-suited for grouping countries based on multiple indicators.
The researchers compared different software tools to carry out the analysis. Free platforms like Sciencehunter and NCSS Statistical Software supported automated clustering, making them useful for initial grouping. For more advanced analysis and flexibility, tools such as RStudio and Excel Macros were considered, though these typically required more manual setup or programming.
A variety of clustering algorithms were applied. These methods fall into two main categories—hierarchical and non-hierarchical. The main technique used was the Self-Organizing Map (SOM) algorithm, which belongs to the hierarchical group. It is a type of neural network that transforms complex multi-dimensional data into a simplified two-dimensional map while preserving the structure of relationships between countries.
Additional methods included classical hierarchical clustering using dendrograms and the k-means algorithm, which is a non-hierarchical approach that iteratively refines cluster assignments to reduce variability within each group. To improve the robustness of the analysis, the k-medoids algorithm was also used. This method, also known as the medoid partitioning technique, is similar to k-means but uses actual data points to define cluster centers, making it less sensitive to extreme values.
The next part of the study explains how each of these algorithms was used, compares their results, and outlines how they contribute to shaping practical recommendations for improving food security policies across the European Union.
Clustering Methods
The self-organizing map approach, based on unsupervised learning, was used to perform clustering. This method operates by iteratively adjusting a set of weight vectors for each neuron in the system. These vectors represent how each neuron responds to input features. The number of neurons corresponds to the number of clusters, and each neuron's weight is updated over time. A modified competitive learning algorithm was applied, which takes into account not only the most accurate response (the so-called winning neuron) but also the surrounding neurons within a defined proximity.
At the beginning of the training process, random values are assigned to the weights for each feature. Each input object is then introduced to the network, and the neuron with the closest match, known as the Best Matching Unit, is selected based on minimum distance. The network then identifies the surrounding neighborhood of this winning neuron, and its influence area shrinks as the number of training iterations increases.
Subsequently, the weights of selected neurons are updated, taking into account both the distance to the winning neuron and the object’s feature vector. This enables the system to adapt over time and refine cluster boundaries.
The hierarchical clustering technique, specifically the dendrogram method, was also applied. This approach involves grouping items based on similarity, where each item begins as its own cluster. As the algorithm progresses, the closest clusters are merged step-by-step until a hierarchy is formed, often visualized as a tree diagram. In this study, the group average method was chosen, which merges clusters based on the average distance between all objects in the groups.
In addition to hierarchical methods, the study also used the k-means clustering technique, which was originally introduced in 1967. This is one of the most widely adopted iterative clustering methods. It works by randomly selecting initial cluster centers and assigning each object to the nearest center. The algorithm then recalculates the cluster centers based on current group members, repeating the process until cluster membership stabilizes.
This method is well-suited for analyzing large datasets with continuous numeric variables and no outliers. It is particularly effective in minimizing within-cluster differences and maximizing differences between clusters. However, the final number of clusters must be defined in advance, and due to randomness in initial placement, the algorithm may settle on a suboptimal local solution.
To improve accuracy and robustness, the k-medoids method was also used. This method, introduced in the 1980s, is designed to minimize an objective function by shifting real objects (rather than calculated centers) from one cluster to another. It continues this process until no further movement reduces the objective function. Although this may lead to a local minimum, the algorithm can be restarted with different initial configurations to seek better results. In contrast to k-means, the k-medoids method selects actual data points as cluster centers.
Rationale for the Choice of Factors to Study the State of Food Security in the EU
The selection of factors used in this research is a critical aspect of the cluster analysis. Following an analytical review of food security conditions in the European Union, it was determined that there is no acute crisis related to hunger or malnutrition across the region. As a result, the study did not rely on traditional indicators commonly used by the Food and Agriculture Organization, such as per capita calorie consumption, protein intake, or rates of anemia. Instead, the analysis focused on variables more closely aligned with the underlying drivers of global food security, including supply, demand, and international trade dynamics.
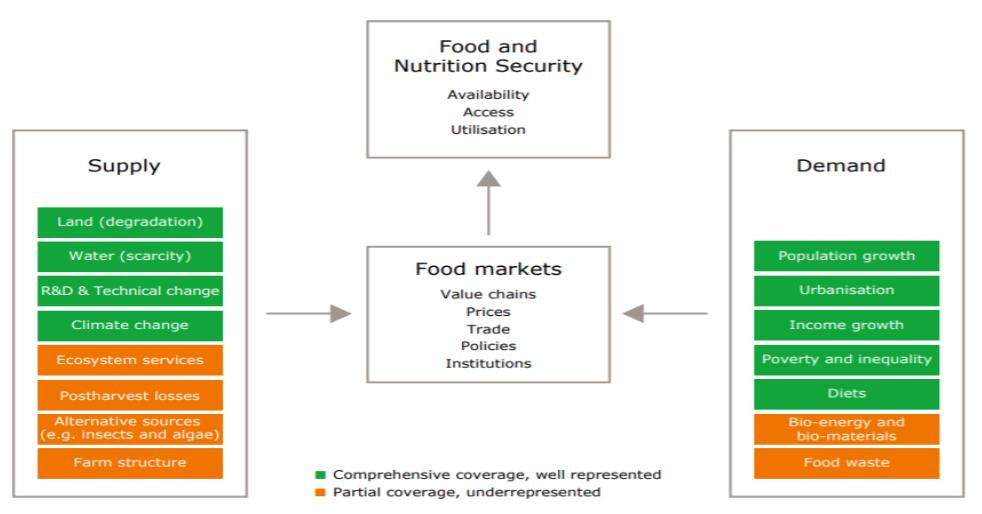
Additional considerations included the role of the agro-industrial sector, public policy support under the Common Agricultural Policy (CAP), and the impact of international food trade. Based on these criteria, five primary factors were selected for the cluster analysis.
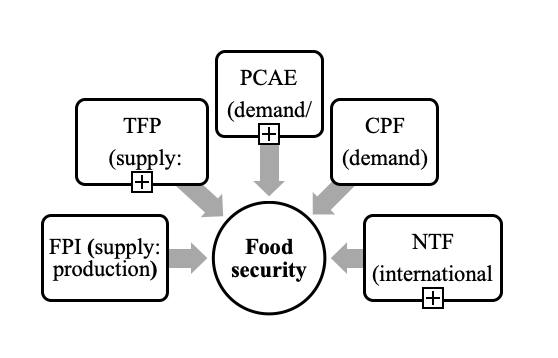
The first selected indicator was the Food Production Index, derived from the World Bank database. This index measures total food production for human consumption and is based on the Laspeyres formula. Production for seed or animal feed is excluded. Data are reported annually and compared against a 2004–2006 baseline. This indicator reflects physical food availability and is categorized as a supply-side factor.
The second indicator was Total Factor Productivity in agriculture, sourced from the Eurostat database. It reflects the growth in agricultural output relative to input costs, capturing the efficiency of land, labor, and capital use. As a contextual CAP indicator, it is particularly important in assessing the impact of technological and economic changes. The base year for this metric is 2005, and a three-year moving average is used to minimize short-term volatility. This indicator represents the sustainability of the food system and is also classified as a supply-side factor.
The third factor was Per Capita Agricultural Expenditure. This was calculated using data from the IFPRI SPEED database, which tracks public agricultural spending. For this analysis, growth was measured by comparing per capita expenditure in 2016 to 2005, adjusting for inflation. While primarily considered a supply factor, this metric also reflects demand-side characteristics, as it includes population data by country.
The fourth indicator was Consumer Prices for Food, based on FAOSTAT data. Monthly price indices were used to calculate year-on-year percentage changes, with 2005 as the base year. The average annual index for 2016 was selected to represent economic accessibility of food. This indicator is grouped under demand factors.
The final indicator was the Net Trade Food Index, calculated using the WITS database. This metric compares food exports and imports across EU countries, generating a value between minus one and plus one. A negative value indicates a net importer, while a positive value indicates a net exporter. The indicator shows the balance of international trade for each country and is used to evaluate their dependence on or contribution to global food markets. Data for 2016 was used for consistency.
Cluster Analysis
Results Interpretation
The software used in this study included R, for building self-organizing maps, and NCSS for complementary analysis. The input dataset consisted of five food security indicators, each converted to index form. Before applying any clustering techniques, the dataset was standardized to ensure comparability, as shown in the supporting data table.
To initiate the analysis, an unsupervised self-organizing map approach was implemented using the RStudio environment. The five selected indicators—Food Production Index, Total Factor Productivity, Per Capita Agricultural Expenditure, Consumer Prices for Food, and Net Trade Food Index—were fed into a neural network with an input layer of five neurons. The network was structured as a three-by-five grid, allowing for a more granular representation of clustering results. This configuration has been previously validated for its effectiveness in similar applications.
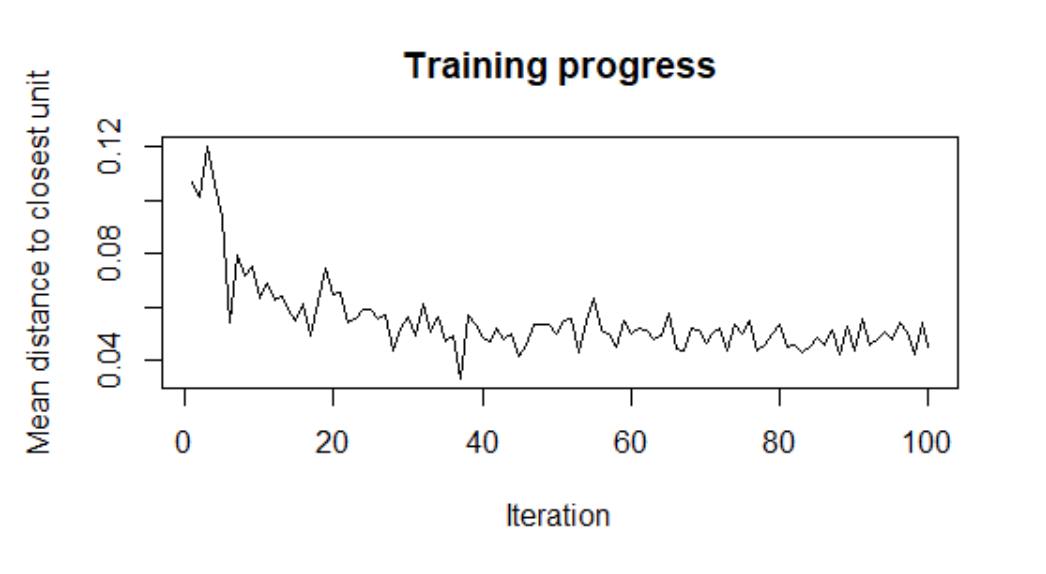
Steps two through four of the algorithm were executed using the Kohonen library in R. These steps were repeated until the network reached stability. The learning rate, referred to as the alpha parameter, was adjusted in a controlled manner—decreasing from 0.05 to 0.01 over the course of training. This setup allowed the network to self-organize effectively for all 27 EU countries.
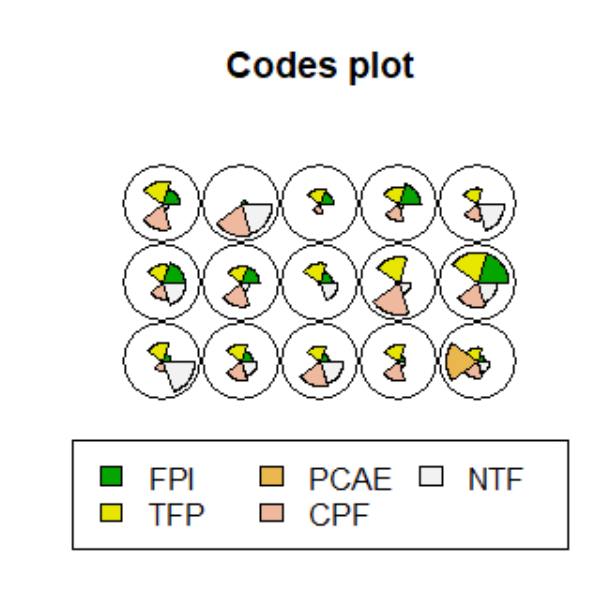
The codes plot provided a visual summary of the five input indicators across all nodes, where each node corresponded to one or more countries.
Using classification commands within R, the mapping of countries to specific nodes was generated. The results showed that multiple countries shared nodes, while others were uniquely mapped.
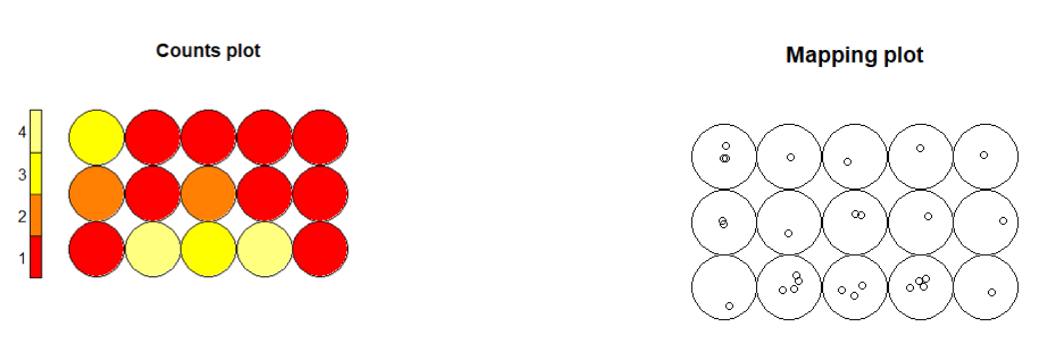
Additional SOM visualizations included counts and mapping plots. The counts plot highlighted how many countries were assigned to each node, using a color gradient from red (fewer countries) to yellow (more countries). The mapping plot showed the precise position of each country as a small circle within the nodes.
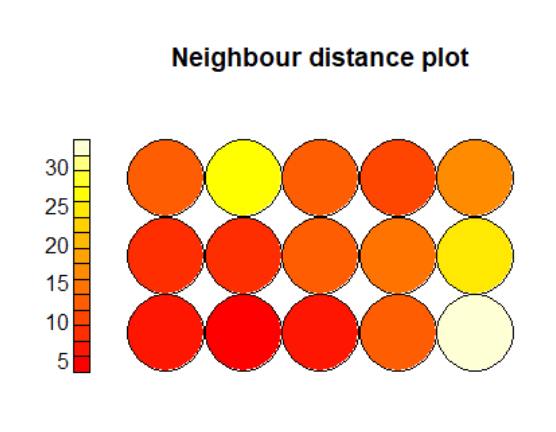
To assess the spatial relationships between countries on the map, a neighbor distance plot was used. This visualization showed that red indicated closer distances between nodes, while white represented the farthest separation. Intermediate shades indicated moderate distances.
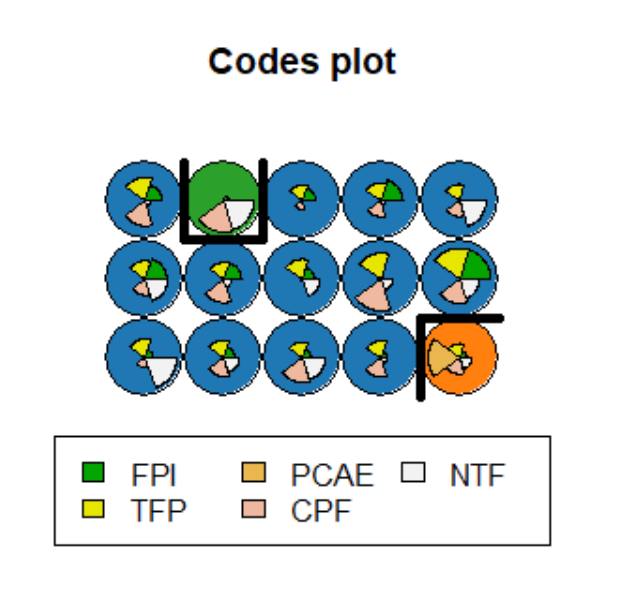
Hierarchical clustering was applied to the output nodes from the SOM map, and three clusters were formed based on variable distribution patterns. The clustered result is shown in the following plot.
Each cluster was then analyzed based on node-to-country assignment. The results indicated that:
- Cluster 1 consisted solely of Malta. This group had the highest consumer prices for food and a positive trade balance but lacked state agricultural support.
- Cluster 2 included only Greece, which showed the highest per capita support but below-average productivity.
- Cluster 3 contained the remaining 25 EU countries. This group exhibited a balance between higher consumer prices and better total factor productivity in agriculture.
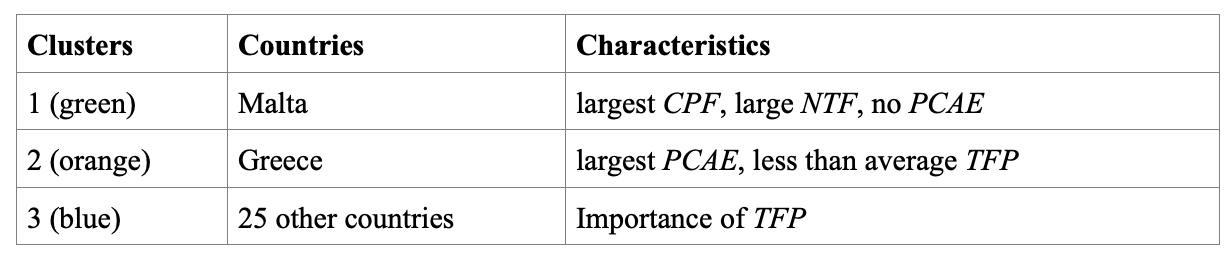
The characteristics of these clusters highlighted differing national profiles. Cluster 1 had high food prices and export orientation but limited public investment. Cluster 2 had significant government support but lagged in productivity. Cluster 3 represented a broader group with relatively balanced performance metrics.
Because two of the three clusters contained only one country each, the distribution was deemed insufficient for a complete interpretation. Therefore, an alternative clustering approach using NCSS software was applied for verification and refinement.
Results of Extended Cluster Analysis and Final Conclusion
Following the initial clustering with self-organizing maps, further validation and refinement were carried out using hierarchical and k-means clustering methods in the NCSS software environment.
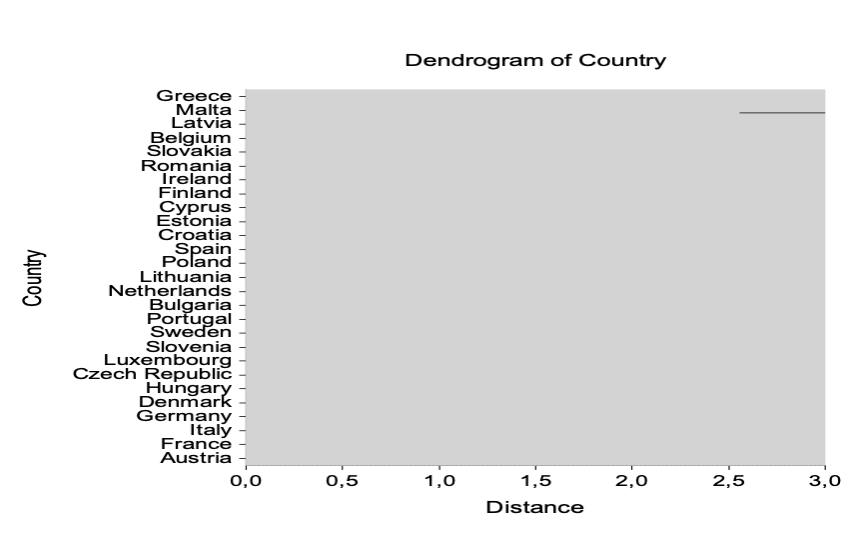
The hierarchical analysis revealed that if the EU countries are divided into three clusters, Malta becomes isolated in a single-country cluster. Increasing the number of clusters results in more countries, such as Latvia and Belgium, forming separate groups. This behavior suggested potential instability in the clustering structure when using fixed thresholds or overly sensitive input variables.
To address this issue, k-means clustering was applied. However, similar outcomes were observed. When dividing countries into two clusters, Greece stood out with significantly higher values of the agricultural support indicator, forming its own group.
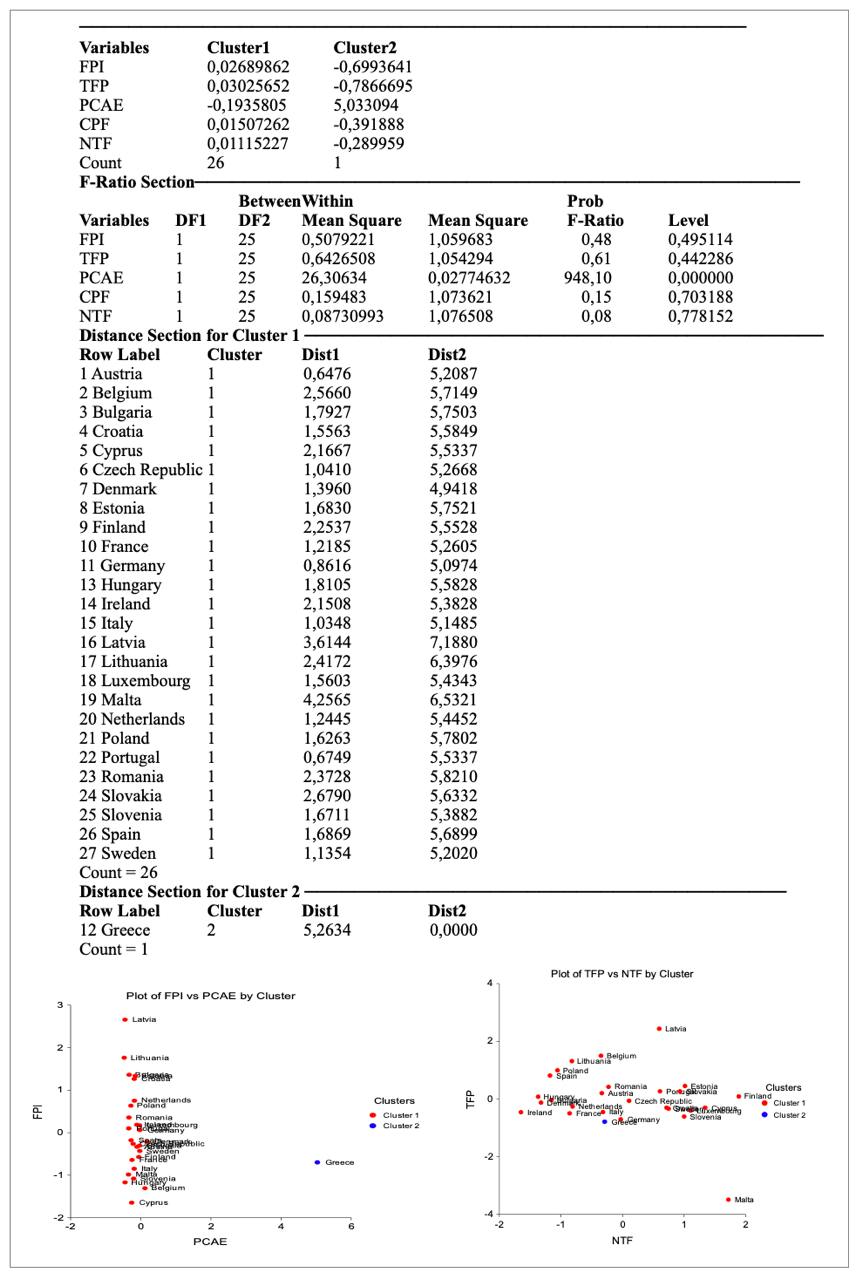
The data showed that the separation of Greece was largely driven by the extreme value of the per capita agricultural expenditure factor. To verify this, the number of clusters was increased to three and then four.

The results revealed that increasing the number of clusters did not solve the issue of single-country clusters. Greece continued to be placed in a separate group, and this indicated a flaw in the segmentation process rather than a meaningful distinction. Thus, the approach was refined once again by applying the k-medoids clustering method.
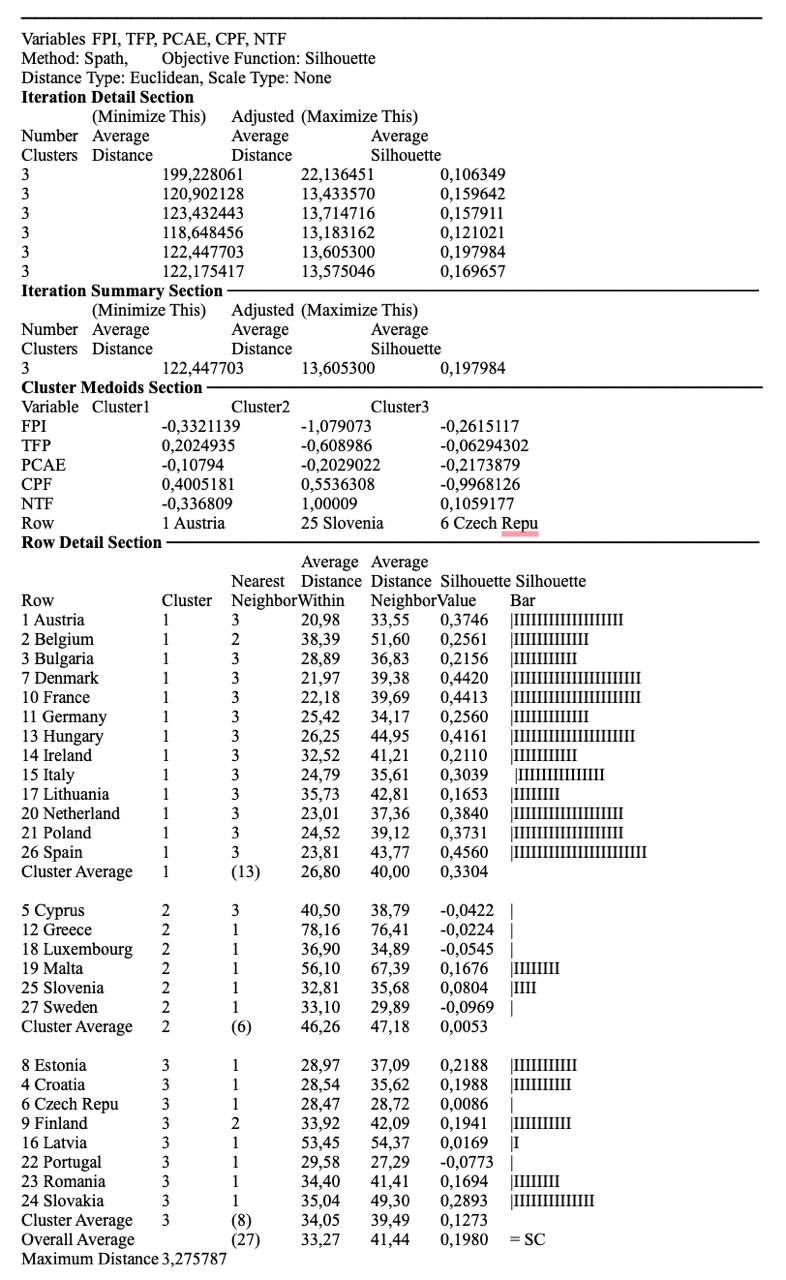
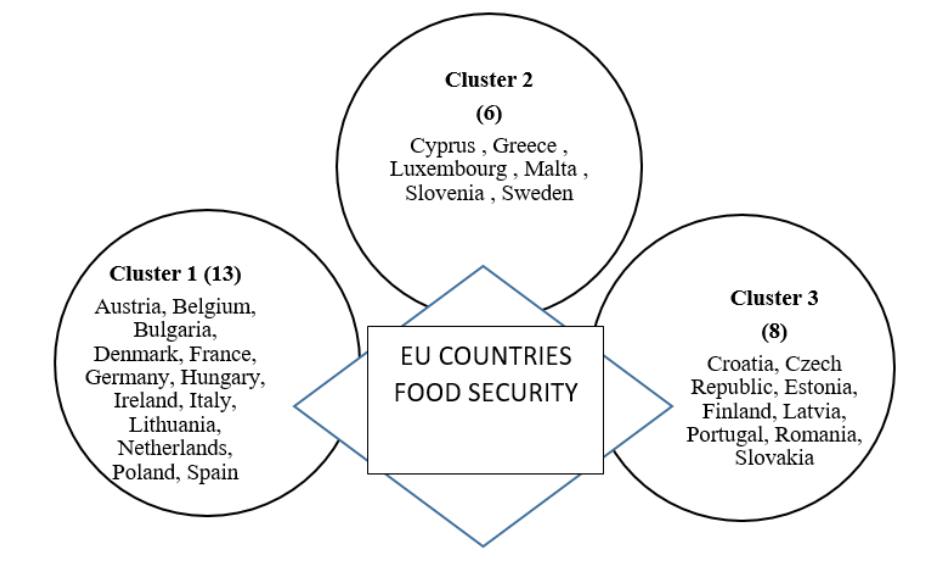
This method produced three stable and interpretable clusters. Each country’s assignment was evaluated using silhouette scores to assess how well it fit within its cluster. The majority of scores were positive, indicating that most countries were correctly grouped.
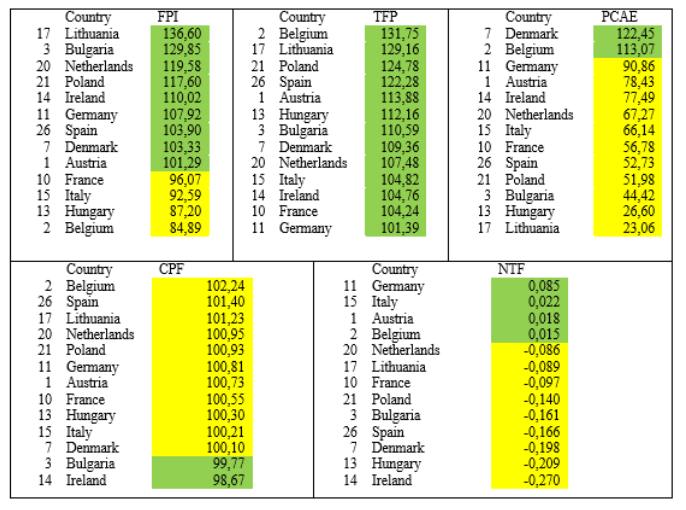
Cluster 1 included thirteen countries, primarily those with high food production, strong agricultural productivity, lower per capita agricultural expenditures, moderate food price inflation, and a mix of net importers and exporters.
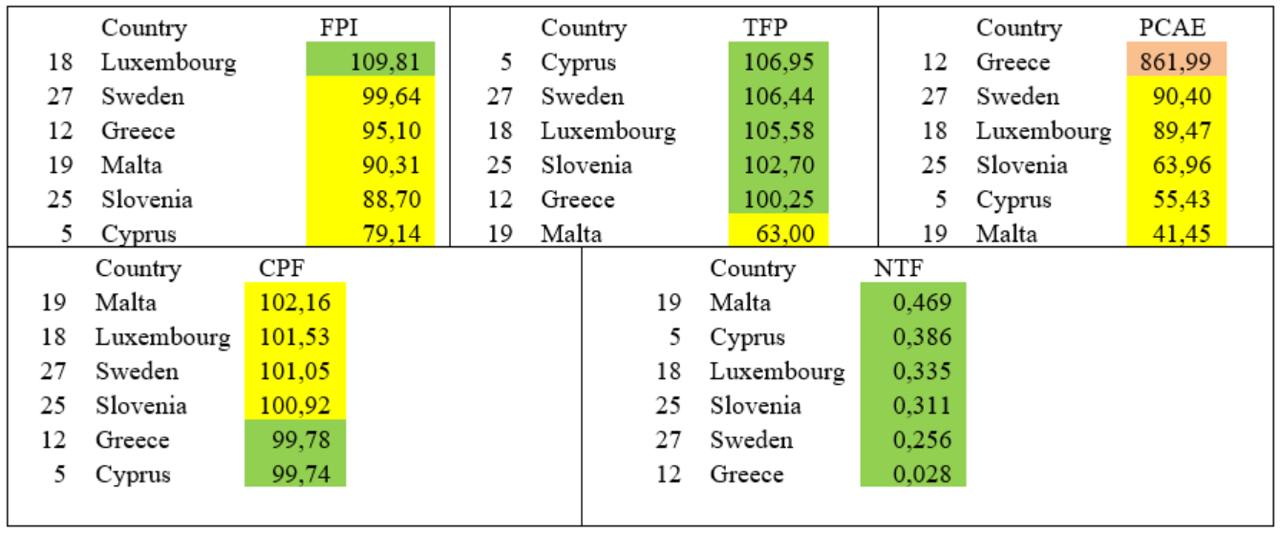
Cluster 2 consisted of six countries, with generally lower food production levels, variable support levels, and moderate to high trade performance. These countries were primarily net food exporters.
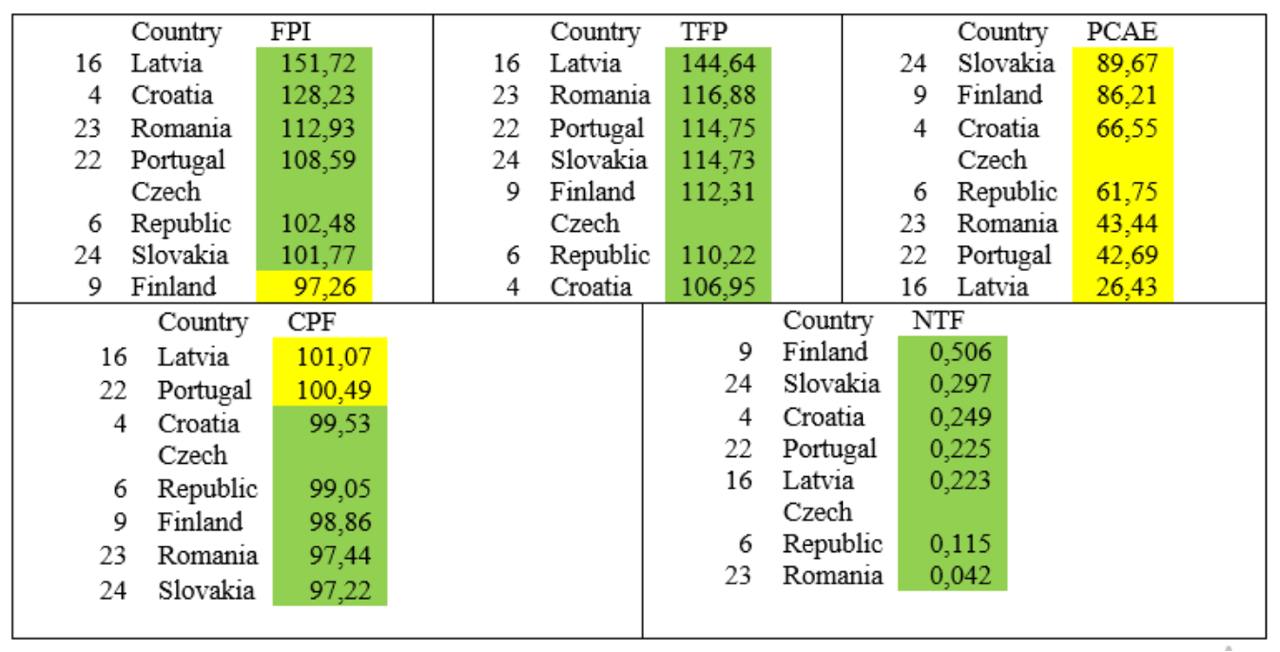
Cluster 3 grouped together countries that had strong food production and productivity, reduced support levels, and were also net exporters, with favorable food price dynamics.
In general, the findings reflect that the EU, as a whole, shows declining public support for agriculture, except for a few cases such as Greece. Surprisingly, many countries that do not prioritize agriculture are net food exporters. At the same time, countries with well-developed agro-industrial sectors—such as France, the Netherlands, and Spain—are often net importers.
There is noticeable food price stability across the EU, with inflation mostly below 2.5 percent. In some countries, such as Ireland, Greece, and Slovakia, food prices have even declined. Although the overall trend in factor productivity is weakening, many EU countries still demonstrate sufficient food production.
Therefore, the overall state of food security in the EU appears to be stable and sufficient. However, cluster analysis reveals considerable internal differentiation. Three clear groups of countries were identified, each with distinct characteristics in terms of food production, productivity, pricing, trade, and state support.
The analysis was performed using R (for self-organizing maps) and NCSS software. The input data consisted of five food security factors expressed in index form. Prior to clustering, the dataset was standardized to ensure consistency across variables.
Self-organizing maps (SOMs) were applied using the R programming environment. Five food security indicators — food price index, total factor productivity, public expenditure on agriculture, consumer prices for food, and net trade in food — were fed into the input layer of the neural network. The architecture used included a map of 3 by 5 neurons, which provided detailed cluster differentiation. The effectiveness of this network structure has been confirmed experimentally.
The training process involved iterating through steps until the network stabilized, as guided by a gradually decreasing learning rate parameter (from 0.05 to 0.01). After 100 learning iterations, the average distance between neurons was reduced by approximately half.
A “codes” plot was then generated to display the distribution of the five factors across 27 countries. Each node of the map visually represents the relative strength of each factor.
The classification results were mapped using a command that links specific countries to particular neurons. As a result, countries were distributed across 15 nodes.
– A “counts” map, showing how many countries fall into each node.
– A “mapping” plot, showing individual countries as small circles.
The SOM also provided a visualization of the distance between neighboring map nodes. In this plot, red signifies the smallest distance between countries, while lighter colors indicate greater separation.
After setting the number of clusters to three, a hierarchical clustering approach was applied to the SOM nodes. The resulting “codes” map visually displayed the average contribution of each food security factor per cluster.
Cluster assignments and characteristics were summarized as follows:
– Cluster 1 consisted solely of Malta, which showed the highest values for consumer food prices and net trade in food, but limited government support.
– Cluster 2 included Greece, characterized by high agricultural expenditure and low productivity.
– Cluster 3 grouped 25 countries, where the increase in food prices is aligned with improved productivity in agriculture.
Policy Recommendations
Based on the cluster analysis, the following policy suggestions were developed:
Leave space for Table 3: Policy recommendations per cluster
– Cluster 1 countries may benefit from increasing agricultural support to reduce dependency on imports.
– Cluster 2 reflects an optimal level of food security, requiring no immediate intervention.
– Cluster 3 countries are advised to continue reducing state support while maintaining high productivity.
Comparison of Clustering Methods
To evaluate the applied clustering methods, a comparison was conducted between hierarchical and non-hierarchical approaches.
Leave space for Table 4: Advantages and disadvantages of clustering methods
The hierarchical method using dendrograms provided strong data visualization but required pre-setting the number of clusters and was sensitive to outliers. Self-organizing maps, also a hierarchical method, offered advantages such as self-organization and high visual clarity, but involved longer processing times and the same drawbacks related to cluster number and outliers.
Non-hierarchical methods such as k-means and k-medoids showed better speed and usability. While k-means was sensitive to outliers, k-medoids handled them better and provided more accurate results overall.
Both types of clustering methods contributed meaningful insights, with SOM and dendrograms excelling in interpretability, and k-means and k-medoids providing clarity, transparency, and detailed results.
Conclusions
This study examined theoretical and methodological tools for cluster analysis with a focus on food security within the European Union. The choice of food security indicators was grounded in economic and policy considerations. The analysis involved the application of four clustering methods: self-organizing maps, dendrograms, k-means, and k-medoids. Based on these methods, EU countries were grouped into three clusters representing different states of food security.
The results made it possible to evaluate the strengths and limitations of each clustering method. Self-organizing maps and dendrograms were found to be effective tools for data visualization. In contrast, k-means and k-medoids delivered more detailed and precise clustering outcomes.
At the EU level, food security is generally considered stable. However, cluster analysis revealed internal heterogeneity across member countries. This variance was significantly reduced when countries were grouped into clusters with similar characteristics.
The first cluster includes net food importers. These countries exhibit high values for the food price index and total factor productivity growth, low agricultural support, and rising consumer food prices. For this group, it is recommended to increase agricultural support in order to reduce dependence on food imports.
The second cluster includes net food exporters that demonstrate high productivity and rising food prices, alongside reduced government support. Food security in these countries is assessed as stable and requires no immediate policy adjustment.
The third cluster includes net food exporters characterized by sustained productivity and falling consumer food prices, along with a continuing decline in state support. These countries are advised to maintain their current agricultural policy focused on reduced government intervention.
Overall, cluster analysis has proven to be an effective tool for segmenting EU countries based on food security metrics. It allows for the identification of country groups with similar structural and economic conditions, and supports the development of differentiated strategies for improving food security. These strategies should consider the starting conditions of each country to ensure relevance and impact.


Tell us about your project needs


.png)