


The table of content
This article is a summary of the scientific work published by Svitlana Turlakova
The original source can be accessed via DOI 10.33111/nfmte.2022.048
Introduction
In today’s fast-paced business environment, leaders face unprecedented volatility both inside and outside their organizations. With information flowing from countless channels, managers often lack the capacity to process every data point independently. Under such conditions, decision-makers may unconsciously lean on the choices or opinions of their peers—giving rise to herd behavior that can amplify risk and stifle innovation.
At the heart of this phenomenon lie cognitive biases—conformity, familiarity bias, zero-risk preference, and deference to authority, to name a few—that skew judgment and drive collective actions. Pioneering research in behavioral economics has long shown that individuals rarely act as purely rational agents. Early critiques by Maurice Allais challenged the notion of absolute rationality, while Daniel Kahneman and Amos Tversky demonstrated how reference points can radically alter perceived value. Richard Thaler further illuminated how these “mental shortcuts” distort decision-making, often leading to suboptimal outcomes.
Scholars have explored how herd behavior manifests across industries—from financial markets and consumer trends to bank lending and cooperative social initiatives. For instance, experimental studies using Kohonen self-organizing maps have categorized participants as “reciprocators” or “free-riders” based on their public-goods contributions. Within the corporate realm, research highlights how currency panics and market fluctuations can spill over into operational decisions, while other work underscores the generality—and thus limited actionability—of existing herd-behavior models.
Attempts to manage these dynamics at the enterprise level have produced promising frameworks. Some propose gauging staff support for organizational changes by tracking information flows, others recommend leveraging reflexive tactics to ease resistance. Yet none offer a clear, quantitative method to measure the very reflexive traits—such as conformity propensity or authority bias—that drive herd dynamics. Without these metrics, executives lack the levers needed to steer collective behavior toward strategic goals.
Purpose of This Study
To fill this gap, we introduce a novel, mathematically grounded approach for quantifying the reflexive characteristics of decision-makers. By translating cognitive biases into actionable parameters, our method equips leaders with the tools to diagnose, predict, and guide herd behavior—transforming an age-old challenge into a strategic asset.
Methodology
The proposed methodology for quantifying reflexive traits and steering herd behavior in enterprises is founded on a structured survey that examines five interconnected dimensions of managerial decision-making: awareness, competence, authority, imitation propensity, and decision-value orientation. Each survey response is mapped into a numerical membership degree between zero and one through Zadeh’s fuzzy-set framework. For instance, in evaluating imitation propensity, a manager who prefers to tackle challenges independently is assigned a membership score of 0, while one who coordinates solutions with peers is scored as 1, and intermediate behaviors receive proportional values such as 0.5. Likewise, awareness is assessed by contrasting sole reliance on personal intuition (score 0) with a thorough review of official data and collaborative discussion (score 1).
Authority and competence dimensions draw on established psychometric instruments: R. Cattell’s 16-factor personality clusters inform the authority scale—capturing dominance, self-confidence, and informal influence—while McClelland’s competence framework, refined by Spencer and Spencer, underpins questions addressing achievement drive, analytical thinking, and initiative. Decision-value orientation is calibrated according to Kahneman and Tversky’s prospect theory, prompting respondents to evaluate the personal and organizational stakes of potential outcomes relative to individual reference points.
After converting each management agent’s answers into a five-dimensional fuzzy-membership profile, a fuzzy C-means clustering algorithm uncovers natural groupings, such as “high-authority, low-imitation” leaders versus “high-imitation, low-authority” contributors. These clusters emerge from the data itself, without predefined thresholds or expert bias, and reveal which individuals are most likely to shape or follow collective trends. Average membership scores within each cluster highlight the segments with the greatest potential to influence group behavior and those most susceptible to peer effects.
With these cluster profiles in hand, interventions can be precisely tailored: communications campaigns that reinforce desired decision patterns, specialized workshops that elevate strategic competence, or incentive structures that channel imitation tendencies toward organizational priorities. By transforming unexamined herd behavior into a quantifiable network of reflexive traits, enterprises gain the ability to predict decision cascades, guide collective dynamics, and align group actions with long-term objectives.
The methodology begins by surveying each management agent at a given time t across five reflexive dimensions: awareness, competence, authority, propensity to imitate and intentional orientation. Questions for each dimension are ordered so that response options reflect descending intensity of the trait. Every answer is then translated into a fuzzy-set membership value between 0 and 1. For example, awareness might be scored as 0 when an agent relies solely on personal knowledge, 0.5 if information is partly discussed with colleagues, and 1 if official data and expert sources are exhaustively reviewed. Similar mappings are applied to competence, authority, imitation propensity and intentional orientation.
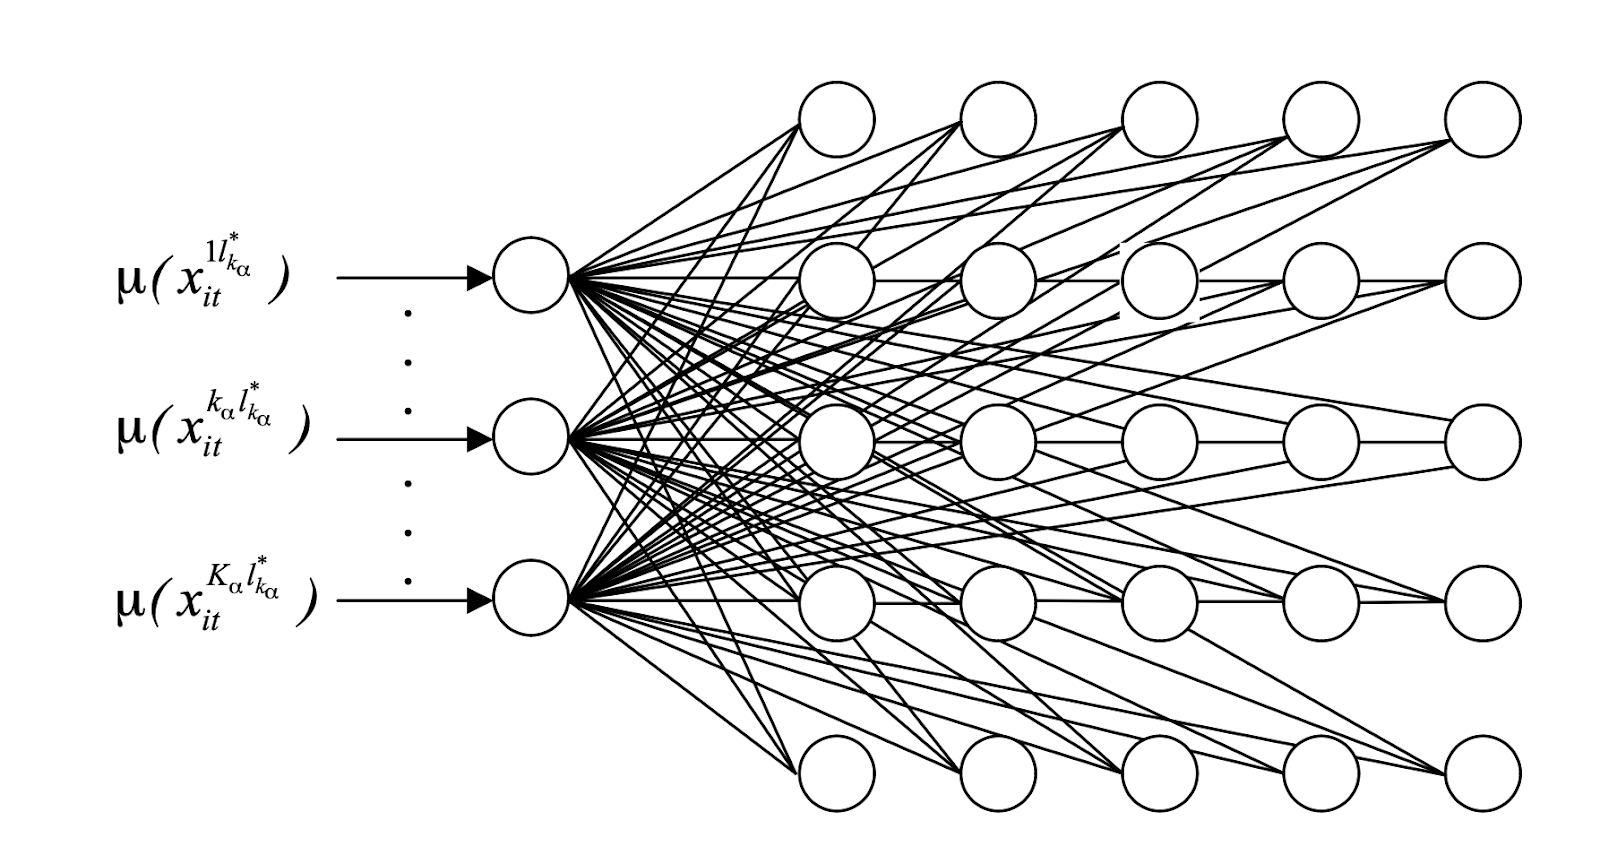
Once each agent’s answers have been converted into their respective fuzzy-set representations—denoted by ordered pairs combining questionnaire items and their membership values—a self-organizing map (SOM) algorithm is applied for clustering. In this approach, each neuron in a two-dimensional lattice represents a potential cluster center characterized by a weight vector. When an agent’s five-dimensional membership vector is presented to the SOM, neurons compete based on Euclidean distance, and the closest neuron “wins,” assigning the agent to its cluster. During training, both the winning neuron and its neighbors adjust their weight vectors toward the input, gradually refining cluster prototypes. The SOM’s topology ensures that similar reflexive profiles map to nearby neurons, which makes it easy to interpret the landscape of managerial traits.
After training, each neuron’s weight vector represents a typical reflexive profile. Comparing an agent’s input values to these vectors produces five numerical scores—one for each dimension—that can be read as probabilities. For example, an agent’s awareness score indicates how likely they are to be fully informed at a given moment, while their imitation score shows how likely they are to follow their peers. These clear, quantitative indicators make it easy to compare individuals and identify who will lead or follow in group decisions.
By examining which clusters contain high-authority agents prone to imitation or groups with low awareness but strong intentional orientation, decision-makers can craft precision interventions—tailored training, targeted communications or incentive adjustments—aimed at steering herd dynamics in alignment with strategic objectives. Thus, subjective cognitive biases are transformed into measurable parameters, and herd behavior becomes a manageable organizational asset.
Experiment Results
The proposed approach was tested at the Novokramatorsky Mashinostroitelny Zavod in the context of selecting a supplier for components of an electric overhead foundry crane. A tender commission of 20 members—including the commission chairman, auditors, accounting, design and procurement specialists—was formed to evaluate two commercial proposals. Each member (Agent 1 through Agent 20) completed questionnaires across the five reflexive dimensions, and the raw responses were converted into fuzzy-membership values.
The resulting awareness scores for all 20 agents are presented in Table 1.
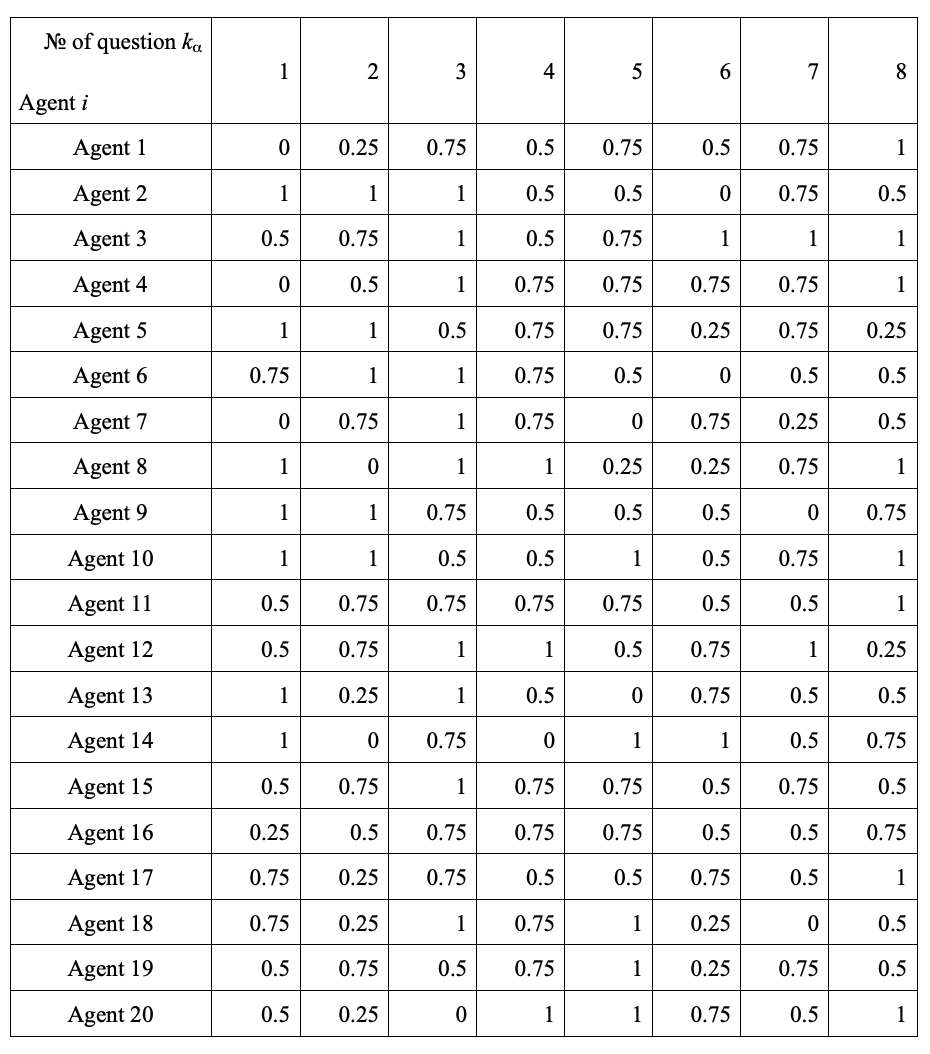
Using these membership values as input vectors, a Kohonen self-organizing map was trained to cluster agents by their level of awareness. The resulting map is shown in Figure 2.
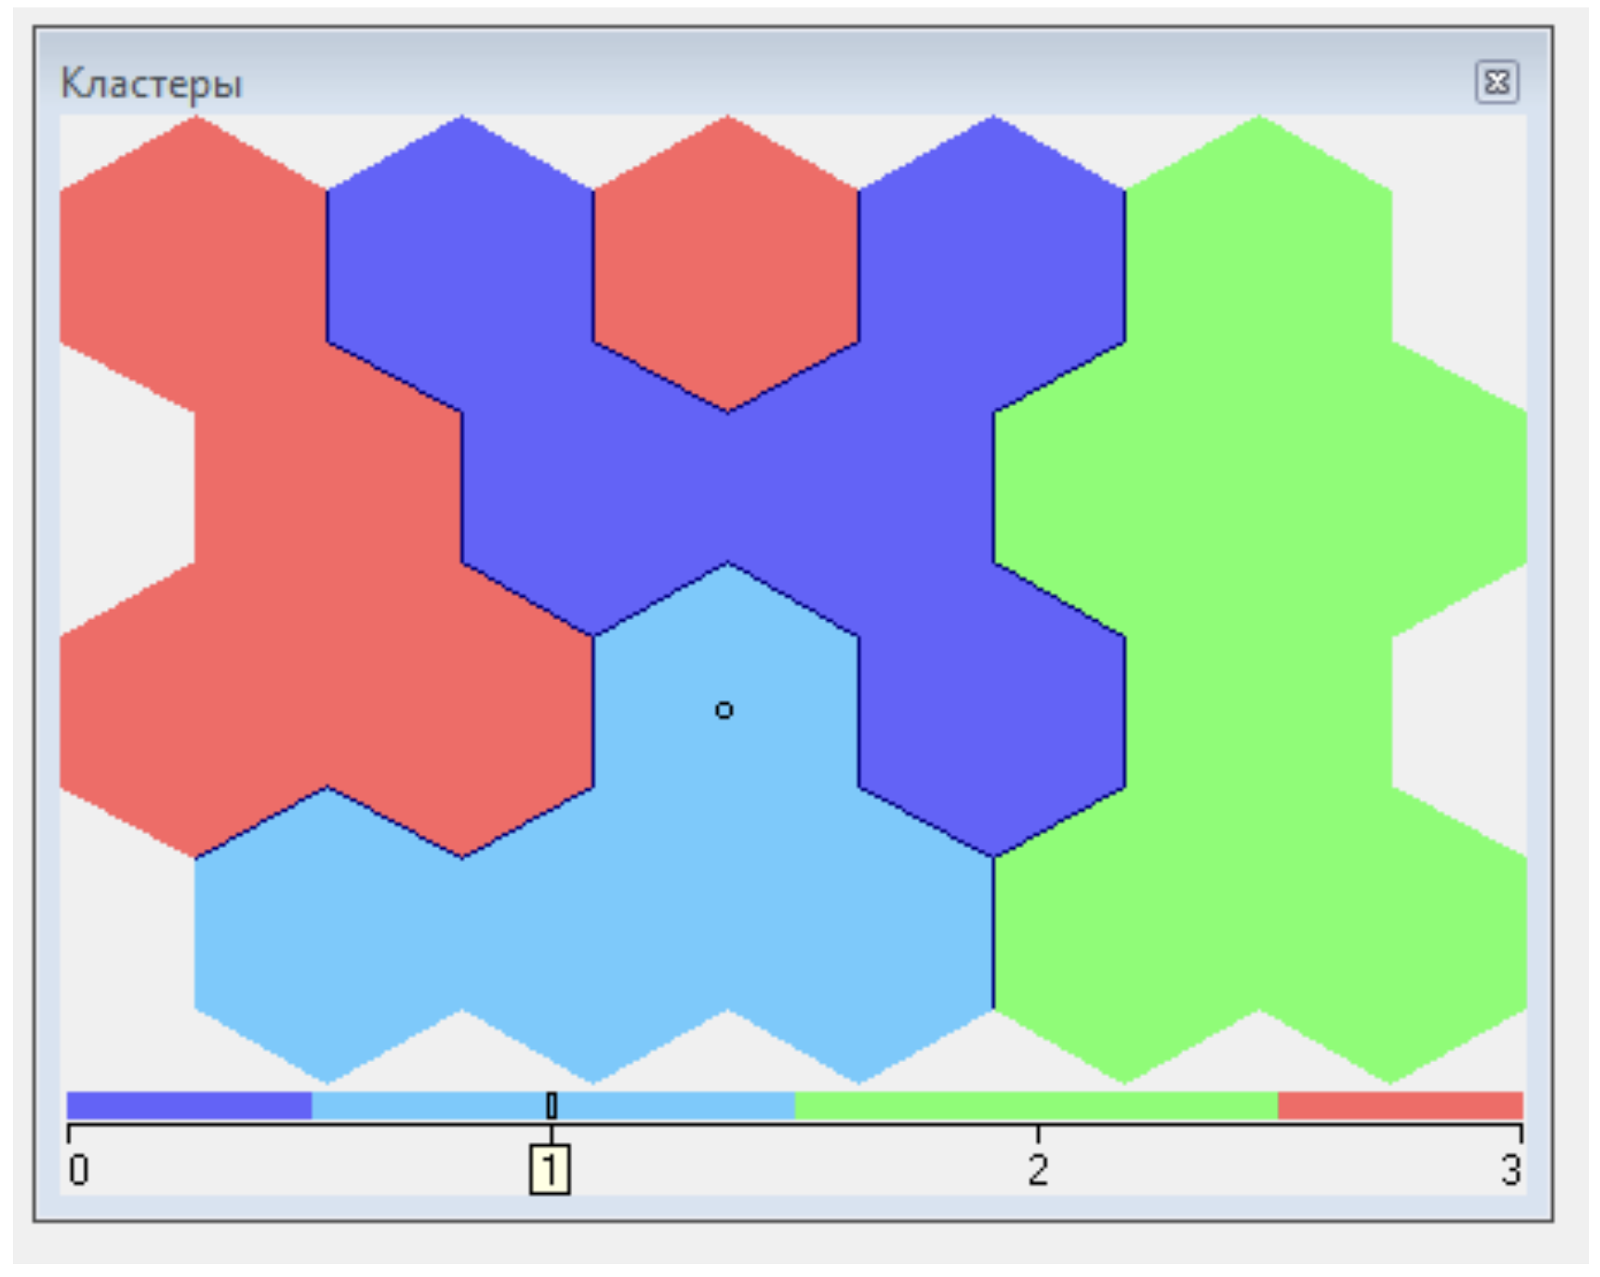
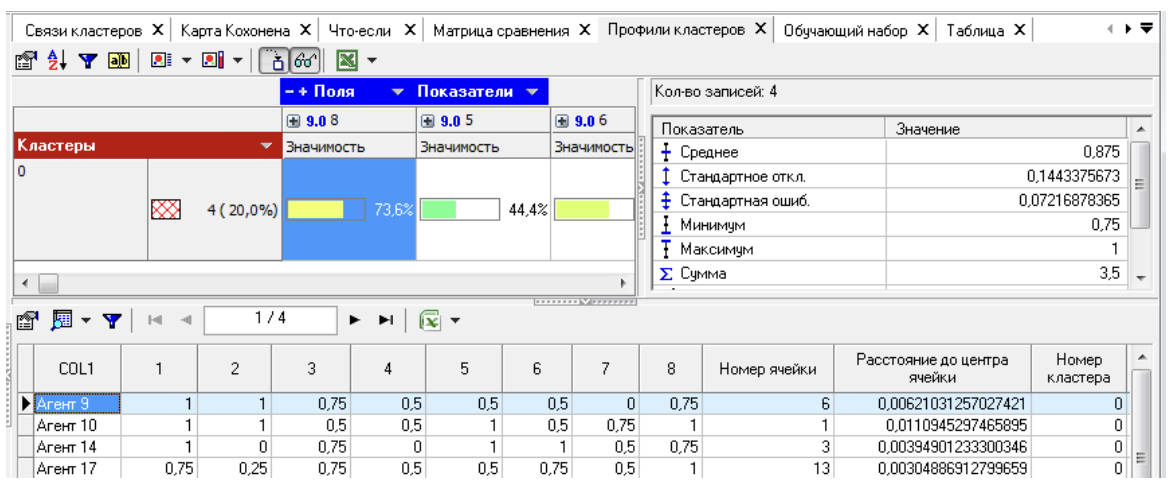
Clustering produced four distinct groups, numbered 0 through 3 on the map’s color scale. Cluster 0 contains Agents 9, 10, 14 and 17, whose average awareness score is 0.875. Cluster 1 groups Agents 7, 8, 12 and 13 with an average of 0.5625. Cluster 2 comprises Agents 1, 3, 4, 11, 16 and 20, averaging 0.9583. Cluster 3 includes Agents 2, 5, 6, 15, 18 and 19, whose mean is 0.4583. The detailed characteristics of Cluster 0 are summarized in Figure 3.
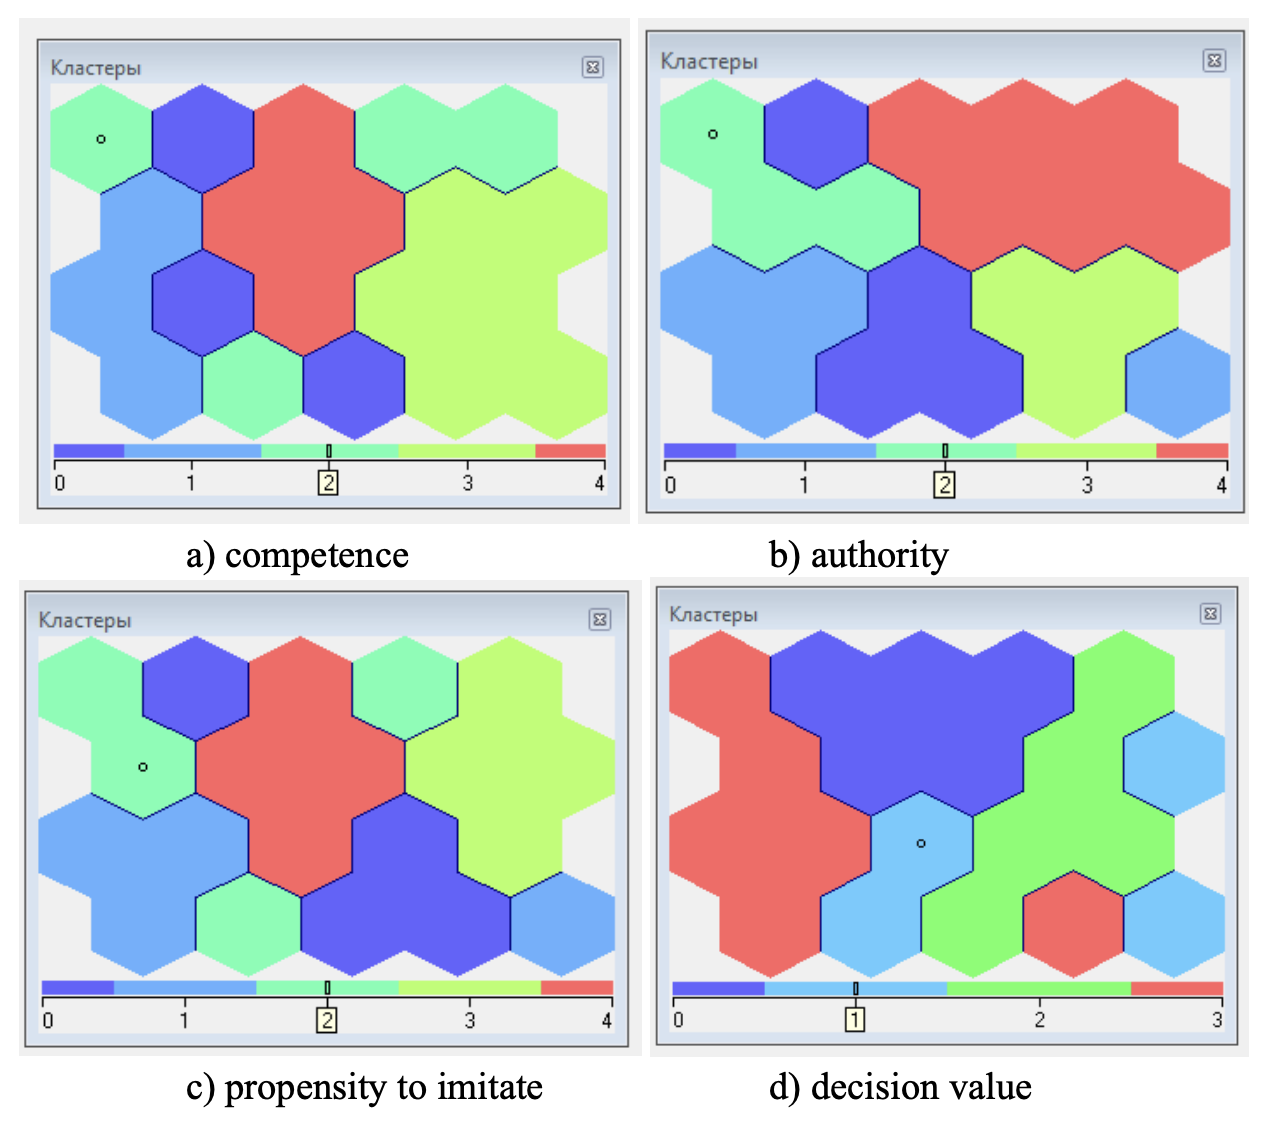
The same procedure was applied to competence, authority, imitation propensity and decision-value orientation, yielding the cluster maps in Figure 4.
From each neuron’s weight vector on the trained map, the average membership scores for all five dimensions were extracted for each agent. Table 2 summarizes these reflexive characteristics.

For example, Agent 1 exhibits high awareness (0.9583), strong competence (0.8) and authority (0.83), moderate imitation propensity (0.625) and a decision-value score of 0.7083. Agent 4 (with authority = 1 and competence = 0.8) emerges as the optimal leader to influence peers: directing messages and incentives toward Agent 4 is expected to trigger imitation among other members.ms herd behavior from an unpredicative asset
By selecting leaders whose reflexive profiles combine maximum authority and competence, managerial actions can be precisely targeted to initiate controlled herd behavior, align group decisions with strategic goals, and forecast outcomes of alternative options.
Conclusions
Determining reflexive characteristics of decision-makers within an enterprise requires an integrated approach combining structured surveys, fuzzy-set theory, and neural-network clustering. First, five key traits—awareness, competence, authority, imitation propensity and decision-value orientation—are measured via targeted questionnaires whose linguistic responses are translated into membership values on a [0,1] scale. These fuzzy-set representations are then fed into a Kohonen self-organizing map, which groups agents into clusters based solely on the inherent patterns of their reflexive profiles.
Once the SOM has been trained, each neuron’s weight vector defines a prototypical reflexive profile. Assigning agents to the nearest neuron yields a set of quantitative indicators—one per trait—that can be interpreted as probabilities. For example, an awareness score of 0.95 indicates a 95 percent likelihood that a given manager is fully informed at a specific decision point. The resulting clusters reveal which individuals are most influential, which are most susceptible to peer effects, and which combine high goal-orientation with low authority.
These insights translate directly into actionable guidance for enterprise leaders. By identifying and empowering those agents whose combination of authority and competence is highest, targeted communications, training modules or incentive programs can be directed precisely where they will trigger positive imitation cascades. Simultaneously, agents exhibiting low awareness or decision-value orientation can be offered tailored support to raise their engagement levels. Therefore, The methodology transfor whose dynamics can be diagnosed, managed and forecasted through the lens of reflexive choice.
Promising avenues for further research include the development of industry-specific diagnostic tools and best-practice frameworks for reflexive management in contexts ranging from board-level strategy meetings to supplier negotiations and change-management initiatives.
References
- Allais, M. (1953). Le comportement de l'homme rationnel devant le risque: critique des postulats et axiomes de l’école américaine. Econometrica, 21(2), 503–549.
- Kahneman, D., & Tversky, А. (1979). Prospect theory: an analysis of decisions under risk. Econometrica, 47(2), 263-291. https://doi.org/10.2307/1914185
- Thaler, R. H. (2015). Misbehaving: The Making of Behavioral Economics. W.W. Norton & Company.
- Yi., H., & Xiugang, Y. (2019). Managers’ Overconfidence, Risk Preference, Herd Behavior and Non-efficient Investment. Independent Journal of Management & Production, 10(1), 56-75. https://doi.org/10.14807/ijmp.v10i1.845
- Loxton, M., Truskett, R., Scarf, B., Sindone, L., Baldry, G., & Zhao, Y. (2020). Consumer behaviour during crises: Preliminary research on how coronavirus has manifested consumer panic buying, herd mentality, changing discretionary spending and the role of the media in influencing behaviour. Journal of risk and financial management, 13(8), Article 166. https://doi.org/10.3390/jrfm13080166
- Pavlović-Höck, N. (2022). Herd behaviour along the consumer buying decision process - experimental study in the mobile communications industry. Digital Business, 2(1), Article 100018. https://doi.org/10.1016/j.digbus.2021.100018
- Fang, H., Lu, Y.-Ch., Shieh, J.C.P., & Lee, Y.-Hs. (2021). The existence and motivations of irrational loan herding and its impact on bank performance when considering different market periods. International Review of Economics & Finance, 73, 420-443. https://doi.org/10.1016/j.iref.2021.01.015
- Merkulova, T., & Kononova, K. (2015). Neyrosetevoy podhod k modelirovaniyu povedeniya: analiz rezultatov eksperimenta «Obschestvennoe blago» [Neural network approach to modeling behavior: the analysis of PG game outcomes]. Neiro-nechitki tekhnolohii modeliuvannia v ekonomitsi (Neuro-Fuzzy Modeling Techniques in Economics), 4, 113–134. http://doi.org/10.33111/nfmte.2015.113 [in Russian]
- Danich, V.M., & Shekhovtsova, K.V. (2013). Valiutna panika, azhiotazh ta yikh vplyv na diialnist pidpryiemstv [Currency Panic, Agiotage and their Influence on Company Activity]. Biznes Inform (Business Inform), 6, 8–13. https://www.business-inform.net/export_pdf/business-inform-2013-6_0-pages-8_13.pdf [in Ukrainian]
- Solodukhin, S. V. (2017). Osnovnyie predposylky postroeniya modeley stadnoho povedeniya vo vneshney i vnutrenney srede predpriyatiy [The main prerequisites for the construction of models of herd behavior in the external and internal environment of enterprises]. Problemy systemnoho pidkhodu v ekonomitsi (Problems of the systemic approach in economy), 4(60), 181–186. http://www.psae-jrnl.nau.in.ua/journal/4_60_2017_ukr/26.pdf [in Russian]
- Lepa, R. M., Okhten, A.A., & Stashkevich, I.I. (2016). Minimizatsiia oporu personalu orhanizatsiinym zminam na pidpryiemstvi [Minimizing personnel resistance to organizational changes at enterprise]. Ekonomika promyslovosti (Economy of industry), 3(75), 90–115. https://doi.org/10.15407/econindustry2016.03.090 [in Ukrainian]
- Stashkevych, I., Turlakova, S., Shevchenko, O., & Derzhevetska, M. (2020). IDEF0-Technology of Modeling of Processes of Minimization the Resistance of the Personnel to Organizational Changes at the Enterprise. WSEAS Transactions on Environment and Development, 16, 286-296. https://doi.org/10.37394/232015.2020.16.30
- Turlakova, S., Vyshnevskyi, O., Lohvinenko, B., & Fomichenko, I. (2020). Role of Reflexive Characteristics of Agents in the Level of Consistency of Goals in the Group. WSEAS Transactions on Environment and Development, 16, 297–304. https://doi.org/10.37394/232015.2020.16.31
- Turlakova, S.S. (2020). Refleksivnoe upravlenie stadnyim povedeniem na predpriyatiyah: kontseptsiya, modeli i metodyi (Reflexive management of herd behavior at enterprises: concept, models and methods). NAN Ukrainy, In-t ekonomiki prom-sti. [in Russian]
- Zadeh, L.A. (2008). Is there a need for fuzzy logic? Information Sciences, 178(13), 2751-2779. https://doi.org/10.1016/j.ins.2008.02.012
- Cattell, R. B. (1988). The meaning and strategic use of factor analysis. In J. R. Nesselroade & R. B. Cattell (Eds.), Handbook of Multivariate Experimental Psychology (pp. 131–203). Plenum Press. https://doi.org/10.1007/978-1-4613-0893-5_4
- McClelland, D. C. (2001). Chapter 27: Where Do We Stand on Assessing Competencies? In J. Raven, & J. Stephenson (Eds.), Counterpoints: Vol. 166. Competence in the learning society (pp. 479–489). Peter Lang AG. https://www.jstor.org/stable/42977810
- Spencer, L. M., & Spencer, S. M. (2008). Competence at Work models for superior performance. John Wiley & Sons.
- Hartigan, J.A., & Wong, M.A. (1979). A k-means clustering algorithm. Journal of the Royal Statistical Society. Series C, 28(1), 100-108. https://doi.org/10.2307/2346830
- Kaufman, L., & Rousseeuw, P. J. (1990). Partitioning Around the Medoids (Program PAM). In Wiley Series in Probability and Statistics. Finding Groups in Data: An Introduction to Cluster Analysis (pp. 68–125). John Wiley & Sons. https://doi.org/10.1002/9780470316801.ch2
- Jolliffe, I.T. (2002). Principal Component Analysis (2nd ed.). Springer. https://link.springer.com/book/10.1007/b98835
- van der Maaten, L., & Hinton, G. E. (2008). Visualizing High-Dimensional Data Using t-SNE, Journal of Machine Learning Research, 9, 2579-2605. https://lvdmaaten.github.io/publications/papers/JMLR_2008.pdf
- Sokal, R., & Rohlf, F. (1962). The comparison of dendrograms by objective methods. Taxon, 11, 33-40. https://doi.org/10.2307/1217208
- Caliński, T., & Harabasz, J. (1974). A Dendrite Method for Cluster Analysis. Communications in Statistics - Theory and Methods, 3, 1-27. https://doi.org/10.1080/03610927408827101
- Schubert, E., Sander, J., Ester, M., Kriegel, H., & Xu, X. (2017). DBSCAN revisited, revisited: Why and how you should (still) use DBSCAN. ACM Transactions on Database Systems, 42(3), 1-21. https://doi.org/10.1145/3068335
- McInnes, L., & Healy, J. (2018). UMAP: Uniform Manifold Approximation and Projection for Dimension Reduction. arXiv. https://doi.org/10.48550/arXiv.1802.03426
- Zhang, T., Ramakrishnan, R., & Livny, M. (1996). BIRCH: an efficient data clustering method for very large databases. In Proceedings of the 1996 ACM SIGMOD international conference on Management of data (pp. 103–114). ACM. https://doi.org/10.1145/233269.233324
- Kohonen, T. (2001). Self-Organizing Maps. Springer–Verlag.
- Kohonen, T. (2008). Data management by self-organizing maps. In J.M. Zurada, G.G. Yen, & J. Wang (Eds.), Lecture Notes in Computer Science: Vol. 5050. Congress on Computational Intelligence: Research Frontiers (pp. 309-332). Springer. https://doi.org/10.1007/978-3-540-68860-0_15
- Kohonen, T. (2013). Essentials of the self-organizing map. Neural Networks, 37, 52-65. https://doi.org/10.1016/j.neunet.2012.09.018
- Mariño, L., & de Carvalho, F. (2022). Two weighted c-medoids batch SOM algorithms for dissimilarity data. Information Sciences, 607, 603-619. https://doi.org/10.1016/j.ins.2022.06.019
- Kobets, V., & Novak, O. (2021). EU countries clustering for the state of food security using machine learning techniques. Neuro-Fuzzy Modeling Techniques in Economics, 10, 86-118. https://doi.org/10.33111/nfmte.2021.086
- Kobets, V., & Yatsenko, V. (2019). Influence of the fourth industrial revolution on divergence and convergence of economic inequality for various countries. Neiro-Nechitki Tekhnolohii Modelyuvannya v Ekonomitsi (Neuro-Fuzzy Modeling Techniques in Economics), 8, 124-146. http://doi.org/10.33111/nfmte.2019.124
- Subasi, A. (2020). Clustering examples. In Practical Machine Learning for Data Analysis Using Python (pp. 465-511). Elsevier. http://doi.org/10.1016/b978-0-12-821379-7.00007-2
- Kaski, S. (2011). Self-Organizing Maps. In C. Sammut, G.I. Webb (Eds.), Encyclopedia of Machine Learning (pp. 886-888). Springer. https://doi.org/10.1007/978-0-387-30164-8_746
- Matviychuk, A., Lukianenko, O., & Miroshnychenko, I. (2019). Neuro-fuzzy model of country’s investment potential assessment. Fuzzy economic review, 24(2), 65-88. https://doi.org/10.25102/fer.2019.02.04
- Lo, Z.-P., Fujita, M., & Bavarian, B. (1991). Analysis of neighborhood interaction in Kohonen neural networks. In 6th International Parallel Processing Symposium Proceedings (pp. 247–249). IEEE Computer Society.


Tell us about your project needs


.png)