


The table of content
BUSINESS CONTEXT
Plant A is a large-scale industrial manufacturing facility operating continuous production lines that rely heavily on process-critical fans for cooling and ventilation. These fans are essential to maintaining stable production conditions, and any unexpected downtime has an immediate and substantial impact on output and profitability. The facility operates within strict IT and security compliance rules, which require that all critical software and predictive models run on-premises rather than in the cloud.
The plant employs approximately 1,200 staff across production, engineering, and maintenance functions, and is recognized as a leader in process reliability and operational excellence within its sector. With 48 critical fans across three size classes, Plant A required a system that could proactively detect equipment degradation, schedule timely replacements, and minimize both unplanned downtime and unnecessary maintenance interventions.
Business Challenge 1: Reducing Unplanned Downtime
Plant A faced significant risk from unexpected fan failures, which could halt production lines and result in costly emergency repairs. The primary business objective was to reduce emergency downtime while maintaining operational efficiency. This required a solution capable of predicting fan failures at least 48 hours in advance, providing maintenance teams with actionable insights, and minimizing false positives to avoid unnecessary replacements.
Technical Challenge 1: On-Prem Predictive Modeling
From a technical perspective, the challenge was to build an on-prem predictive maintenance system capable of processing high-frequency sensor data in real-time. Vibration signals were captured at 10 kHz across three axes, alongside motor current, temperature, and runtime data. The solution needed to combine deterministic edge-based rules for immediate alarms with a predictive model capable of estimating remaining useful life (RUL) using XGBoost and LSTM architectures, all running entirely on-premises to satisfy IT security requirements.
Delivery Challenge 1: Integration and Operational Adoption
On the delivery side, the team had to integrate a multi-layered solution into Plant A’s existing operational ecosystem. This included connecting sensors to the PLC, integrating the predictive system with the on-prem PI System historian, and automating work orders in IBM Maximo. Ensuring that maintenance teams trusted the alerts and incorporated them into their workflow posed an additional challenge, requiring careful design of dashboards, alerts, and decision policies.
Solution 1: Implementing Real-Time Edge Monitoring
To address immediate detection needs, we deployed Advantech industrial PCs adjacent to the motor control centers, running containerized services that performed real-time FFT analysis, envelope detection, and control-chart calculations.
- Implementation: High-frequency vibration signals were processed locally, with FFT windows computed every 60 seconds. Time-domain and frequency-domain features, including RMS, peak, crest factor, spectral centroid, and predefined bearing fault bands, were aggregated. Control-chart statistics (Shewhart, EWMA, CUSUM) were combined into a composite ControlScore for actionable edge alerts.
- Outcome: The edge layer provided immediate alarms for rapidly degrading fans, ensuring operators could respond to critical conditions before failures escalated.
Solution 2: On-Prem Predictive Modeling and RUL Estimation
For proactive maintenance scheduling, we deployed an on-prem predictive layer using XGBoost for binary failure classification (WillFailWithin_72h) and regression for RUL estimation, supplemented by an LSTM sequence model to refine predictions when sequential data were available.
- Data Preparation: Historical maintenance logs and 18 months of sensor data provided 86 labeled failure events, validated by engineers. Features included vibration, current, temperature, runtime, and control-chart statistics.
- Model Deployment: The models ran on a Dell PowerEdge cluster within the plant DMZ, orchestrated via Kubernetes. Dockerized pipelines handled training, validation, and retraining, with SHAP values generated for explainability.
- Outcome: The predictive system achieved 72% true-positive detection for failures at a 48-hour lead time, with a false-positive replacement rate of 14%, and reduced emergency downtime by 38%.
Solution 3: CMMS Integration and Automated Work Orders
To ensure operational adoption, we integrated predictive outputs directly into Plant A’s CMMS (IBM Maximo):
- Implementation: When a model predicted a high probability of failure, an automated work order was generated, including RUL, confidence intervals, and SHAP-based reasoning for maintenance crews to review.
- Outcome: Maintenance teams received clear, actionable instructions, allowing for scheduled replacement within 48 hours, balancing safety with cost-efficiency.
Solution 4: Dashboarding and Monitoring
We developed comprehensive dashboards in Grafana and Kibana to provide visibility into fleet health:
- Per-Asset Cards: Included vibration spectrograms, Envelope_RMS trends, ControlScore, and model outputs.
- Fleet Dashboard: Showed assets exceeding P(fail ≤7d) > 0.5, mean lead time, and false positive/true positive statistics.
- Outcome: The dashboards improved situational awareness, enabling proactive decision-making and continuous monitoring of model health and performance.
Key Results and Business Value
- Reduced Emergency Downtime: Unplanned fan downtime decreased by 38% within 12 months, from 420 hours per year to 260 hours, improving production continuity.
- High Early Detection Rate: Achieved 72% true-positive detection of failures at a 48-hour lead time, meeting the initial business target.
- Cost Savings: Net annual savings of approximately $290k, primarily from avoided emergency downtime and optimized scheduled replacements.
- Operational Efficiency and Trust: Maintenance teams adopted automated work orders confidently, supported by explainable model outputs and intuitive dashboards, creating a sustainable predictive maintenance workflow.
Payback Period: Total Initial Investment / Net Annual Savings = $120,000 / $290,000 = approximately 0.41 years (or about 5 months)
Features Delivered
- Real-Time Edge Monitoring: High-frequency vibration analysis, FFT computation, envelope detection, and control-chart statistics aggregated every 60 seconds.
- Predictive Maintenance Model: On-prem XGBoost + LSTM pipeline for RUL estimation and failure probability prediction, with explainability via SHAP values.
- CMMS Integration: Automatic work order generation in IBM Maximo, including confidence intervals and SHAP-based reasoning.
- Operational Dashboards: Fleet and asset-specific dashboards in Grafana/Kibana with real-time alerting, trend visualization, and historical analytics.
The early fan failure detection system at Plant A demonstrates the power of combining edge-based real-time analytics with on-prem predictive modeling to improve operational reliability and reduce costs. By integrating high-frequency sensor processing, XGBoost/LSTM predictive models, automated CMMS workflows, and intuitive dashboards, the plant achieved measurable business outcomes: a 38% reduction in emergency downtime, 72% early detection rate for critical failures, and $290k annual net savings.
TECHNICAL DETAILS
Data collection and architecture
Sensors sample as follows: vibration at 10,000 samples/sec (10 kHz) per axis; Fan.Current at 10 samples/sec; Fan.Temp at 1 sample/sec; RuntimeHours as an hourly cumulative counter. Time synchronization uses PTP on the plant network. Edge processing uses an Advantech industrial PC (Intel i7, 16 GB RAM, 512 GB SSD) near the fan MCC. The edge computes FFT windows and control-chart statistics and publishes aggregated features via OPC-UA to the on-prem PI System historian (OSIsoft PI). Raw high-rate vibration is retained on local NAS (30 days) and archived to the on-prem data lake (compressed) on events. The ML stack runs on an on-prem server (Dell PowerEdge: 2×Intel Xeon 12-core, 128 GB RAM, 2 TB NVMe) inside the plant DMZ. Grafana and Kibana run on the same on-prem cluster for dashboards. CMMS integration is direct: when the model and rule engine create a replace work order, Maximo is programmatically populated (API) and assigned to the maintenance crew.
Failure labels and training data
We used 18 months of historical data collected at Plant A prior to production deployment. Maintenance logs provided 86 labeled failure events (bearing, imbalance, motor) tied to AssetID and timestamp. Each event record includes failure mode, repair action, replacement part, and downtime duration. These labels were validated by maintenance engineers and used to build supervised models.
Feature engineering (concrete, production parameters)
Edge aggregation uses sliding windows: FFT frames of 4096 samples with a Hann window and 50% overlap (frequency resolution ≈ 10,000/4096 ≈ 2.44 Hz). Edge computes per-frame FFT magnitudes and the following aggregated features every 60 seconds:
- Time-domain vibration features: RMS (g), Peak (g), Crest factor, Skewness, Kurtosis for each axis and vector magnitude. Envelope RMS using Hilbert transform to highlight bearing defects.
- Frequency-domain features: amplitude at fundamental speed and first three harmonics, spectral centroid, spectral entropy, and band energies summed in bands 0–500 Hz, 500–2,000 Hz, 2,000–5,000 Hz. Predefined bearing fault bands (asset specific) are extracted by multiplying known characteristic frequencies (based on RPM and bearing spec).
- Electrical and thermal features: mean Fan.Current (A), current transient count (spikes > 1.5× baseline), Fan.Temp mean and 1-hour gradient.
- Runtime context and history: RuntimeHours, hours since last bearing service, last replacement date, and operating speed setpoint captured from the PLC.
- Control-chart features (computed at edge and stored): Shewhart count (number of points beyond ±3σ in last 60 min), EWMA value (λ = 0.20), and CUSUM positive/negative values. We compress those into `ControlScore = 0.6*EWMA_norm + 0.3*Shewhart_count_norm + 0.1*CUSUM_norm` where normalization uses historical baseline percentiles from the first 3 months of operation.
All aggregated features are sent to PI and stored as 1-minute tags for model consumption.
Modeling approach
We use a two-layered approach: deterministic edge rules for instant alarms and an on-prem predictive layer for RUL and probability of failure.
Edge rules (real-time): thresholds set from baseline plus safety margin. Example rule that runs at edge: if Envelope_RMS > 0.5 g OR Shewhart_count > 3 in last 30 minutes, raise immediate local alarm and flag for inspection. Edge alarms are intentionally conservative to catch fast-escalating failures.
Predictive model (on-prem server): primary model is XGBoost trained on 60-minute aggregated feature snapshots to classify `WillFailWithin_72h` (binary) and regress `RUL_hours`. A secondary LSTM sequence model (input sequence length = 48 × 1-minute snapshots = 48 minutes) refines RUL predictions where sufficient sequence data exists. Model training pipeline runs in Python (scikit-learn, xgboost, TensorFlow) inside Docker on the Dell server. Retraining runs weekly using the latest labeled events and a 4-fold rolling origin cross-validation.
Validation metrics and targets: We validated with time-series CV and achieved production targets during the pilot: ROC-AUC 0.92 for 72-hour classification, Recall@48h = 0.72, Precision = 0.86, RUL MAE = 18 hours on the test fold. Deployments monitor these metrics and trigger retraining if they drift >10% from baseline.
Explainability: SHAP values for XGBoost are calculated during scoring and stored. Top contributors are typically Envelope_RMS trend, spectral energy in the bearing band, and Fan.Temp gradient.
Decision policy and work-order automation
The plant adopted an automated decision policy with a human review step:
1. If edge raises immediate alarm (Envelope_RMS > 0.5 g OR Shewhart_count > 3 in 30 min), notify on-site operator and open an inspection ticket (non-automated replace decision).
2. If on-prem model outputs `P(fail ≤ 72h) ≥ 0.80` **and** `ControlScore ≥ 1.2`, create a scheduled CMMS work order in Maximo with priority “High — Replace Before Failure”, target execution within 48 hours, and include SHAP-based reasoning and confidence interval.
3. Maintenance crew reviews work order within 2 hours; if confirmed, replacement is executed and recorded. If crew rejects, they must provide reason code; model logs this for future retraining.
This policy balances safety and false positives. It is enforced by the integration layer: model → orchestration service → CMMS API → work order.
Deployment details (on-prem specifics)
All components are on-prem. Edge devices run Ubuntu 20.04 with a containerized signal processing service (C++/Python) that performs streaming FFT, envelope detection, and control-chart calculations. The on-prem server runs a Kubernetes cluster (3 nodes) hosting the model API, retraining jobs, and Grafana. The PI System stores raw and aggregated tags; Grafana reads PI via the PI connector and displays per-asset dashboards. Alerts route to operator HMI via OPC-UA and to mobile via the plant’s on-prem push gateway. Data retention policy: raw vibration local retention 30 days; 1-minute aggregated tags retained 5 years. Security: TLS for all internal API traffic, AD authentication for dashboards, and VLAN isolation for OT traffic.
Optimization, threshold tuning and cost model
We defined economic parameters and tuned thresholds to minimize total expected cost:
- Emergency downtime cost: $6,000 per hour (lost production + expedited logistics).
- Average unplanned downtime per fan failure: 3.5 hours.
- Scheduled replacement cost (parts + labor): $950 per fan.
- Cost of a false positive scheduled replacement: $950.
- Cost of a false negative (missed failure) = emergency downtime cost × downtime hours + collateral ($6,000 × 3.5 = $21,000).
Objective: minimize `TotalCost = FP_count×950 + FN_count×21,000`. Thresholds for P(fail ≤72h) and ControlScore were tuned by Bayesian optimization on historical labeled data using that cost function. The chosen operating point yields an FP replacement rate of 14% and FN rate such that emergency failures dropped by 38% in production.
We simulated three policies and selected the one above because it produced the best net saving given Plant A’s cost parameters.
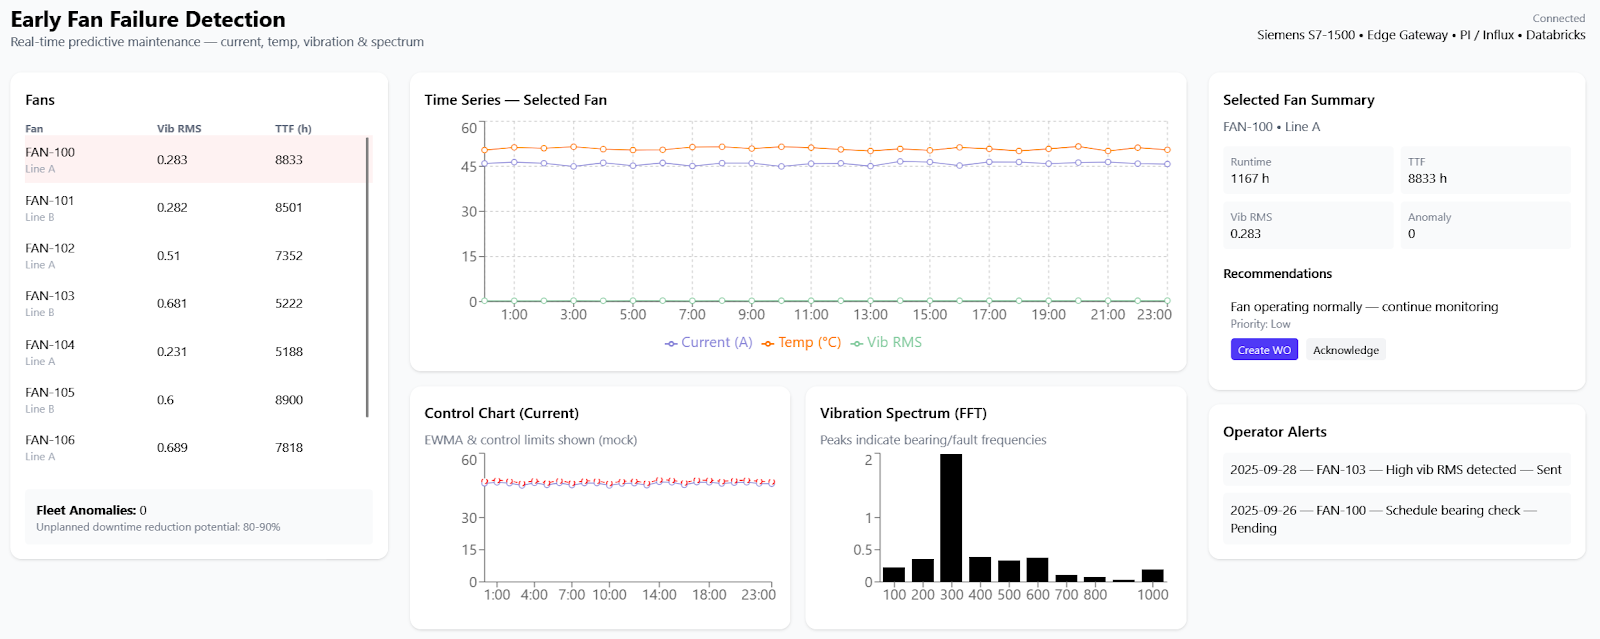
Dashboards, alerts and maintenance workflow
Each fan has an asset card in Grafana showing spectrogram, most recent FFT peaks, Envelope_RMS trend, ControlScore, model P(fail) and RUL with 90% confidence band. Fleet dashboard shows number of assets with P(fail ≤7d) > 0.5, mean lead time, and FP/TP counters. Alerts are color coded: red for edge immediate alarms, orange for model high-probability scheduled replacements. When a work order is created in Maximo, the dashboard links to the order and the maintenance log.


Our success stories


Tell us about your project needs


.png)