


The table of content
BUSINESS CONTEXT
The client is a manufacturer of engineered wood products, operating multiple high-capacity veneer press lines. These lines process thousands of sheets per day, relying on precise control of heating elements, moisture levels, and press speed to achieve both energy efficiency and product quality. The company has a strong reputation for process optimization and sustainability within the wood processing sector and employs over 1,000 operational and technical staff across production, engineering, and quality assurance teams.
Before this project, operators relied primarily on experience and heuristics for press settings, resulting in energy inefficiencies and occasional batch-level quality issues. The client sought a data-driven approach to reduce energy consumption, minimize rejects, and provide actionable guidance for operators, all while integrating seamlessly with existing PLC, Edge, and historian systems.
Business Challenge 1: Reducing Energy Consumption Without Compromising Quality
Veneer pressing is an energy-intensive process, and each kWh saved directly impacts operational costs. However, reducing energy consumption can inadvertently affect product quality, as improper deck temperatures or feed rates can increase batch-level rejects. The business goal was to achieve measurable energy savings (5–10% per ton) while maintaining or improving quality, replacing generic heuristics with data-driven recommendations.
Technical Challenge 1: High-Frequency Data Integration and Feature Engineering
The technical challenge was integrating diverse, high-frequency sensor data from heater power meters, deck thermocouples, inline moisture sensors, and post-press quality scanners. Data arrived from multiple sources, including Siemens S7-1500 PLCs, ET 200SP temperature modules, moisture analyzers, and ROSI inline scanners. Transforming raw data into meaningful features for predictive modeling required careful aggregation, batch alignment, and context inclusion (RecipeID, operator ID, shift).
Delivery Challenge 1: Real-Time Inference and Operator Adoption
Deployment had to support real-time inference, feeding actionable alerts to operators during pressing. This required a robust data pipeline from PLC → Edge → PI Historian → Azure Databricks → PI AF → Grafana dashboards. Additionally, operators needed intuitive, trustworthy recommendations to adjust press settings without disrupting production. Balancing technical sophistication with operational usability was a major delivery challenge.
Solution 1: Data Collection and Historian Integration
To establish a solid data foundation, we connected all relevant sensors to the historian and Edge Gateway:
- Heater Power: Collected via Siempelkamp ContiRoll S7-1500 PLC analog inputs, sampled at 1-second intervals, streamed through PROFINET to the Edge, then to PI System.
- Deck Temperature: Thermocouples installed across the press decks, sampled at 1 Hz, aggregated per batch into temperature vectors.
- Veneer Moisture: Inline moisture sensors with 0.5% accuracy provided per-sheet readings via OPC UA to the historian.
- Post-Press Quality: ROSI inline scanners provided per-sheet defect metrics, aggregated to batch-level reject rates.
By centralizing all measurements in the PI System and aggregating them into batch-level snapshots, we ensured consistent, high-fidelity data for modeling and real-time decision-making.
Solution 2: Feature Engineering and Contextual Metrics
We transformed raw sensor signals into actionable metrics:
- Energy per Ton: Calculated using the formula EnergyPerTon=∑(Heater.kW⋅Δt)Throughputt\text{EnergyPerTon} = \frac{\sum (\text{Heater.kW} \cdot \Delta t)}{\text{Throughput}_t}EnergyPerTon=Throughputt∑(Heater.kW⋅Δt) at 1-second intervals.
- Deck Temperature Profiles: For each batch, we computed mean, max, min, standard deviation, and gradients across zones.
- Moisture Features: Average, deviation, min/max per batch, correlated to reject rates.
- Contextual Variables: RecipeID, operator ID, shift, and throughput rate were included to capture batch-specific operating conditions.
This feature engineering enabled models to identify subtle relationships between energy consumption, press settings, and product quality across thousands of batches.
Solution 3: Predictive Modeling for Energy Optimization
We implemented machine learning regression models to predict energy consumption per ton while maintaining quality targets:
- Primary Algorithm: Gradient Boosting Regression (XGBoost), trained on 12 months of historical batch data (~5,000 batches).
- Benchmarking: Elastic Net Linear Regression provided baseline comparisons for model performance.
- Validation: 80/20 train-test split with cross-validation by batch; performance metrics included RMSE (kWh/t) and R² against actual energy consumption.
- Feature Importance: XGBoost SHAP values highlighted which deck zones or parameters most influenced energy consumption, enabling interpretable recommendations.
The models accurately predicted kWh/t for ongoing batches and were robust to variations in recipe, operator, and shift conditions.
Solution 4: Optimization Engine and Scenario Analysis
To translate predictions into actionable recommendations:
- Scenario Analysis: For each recipe, predicted energy consumption was calculated under observed temperature and moisture conditions.
- Cross-Recipe Comparisons: Energy efficiency and reject rates were overlaid to identify optimal press settings.
- Recommendation Engine: Suggested adjustments to deck temperature zones and feed rates, highlighting batches with potential 5–10% energy savings without increasing rejects.
These recommendations were fed into the operator dashboards in near real-time, replacing heuristic-based decision-making with data-driven guidance.
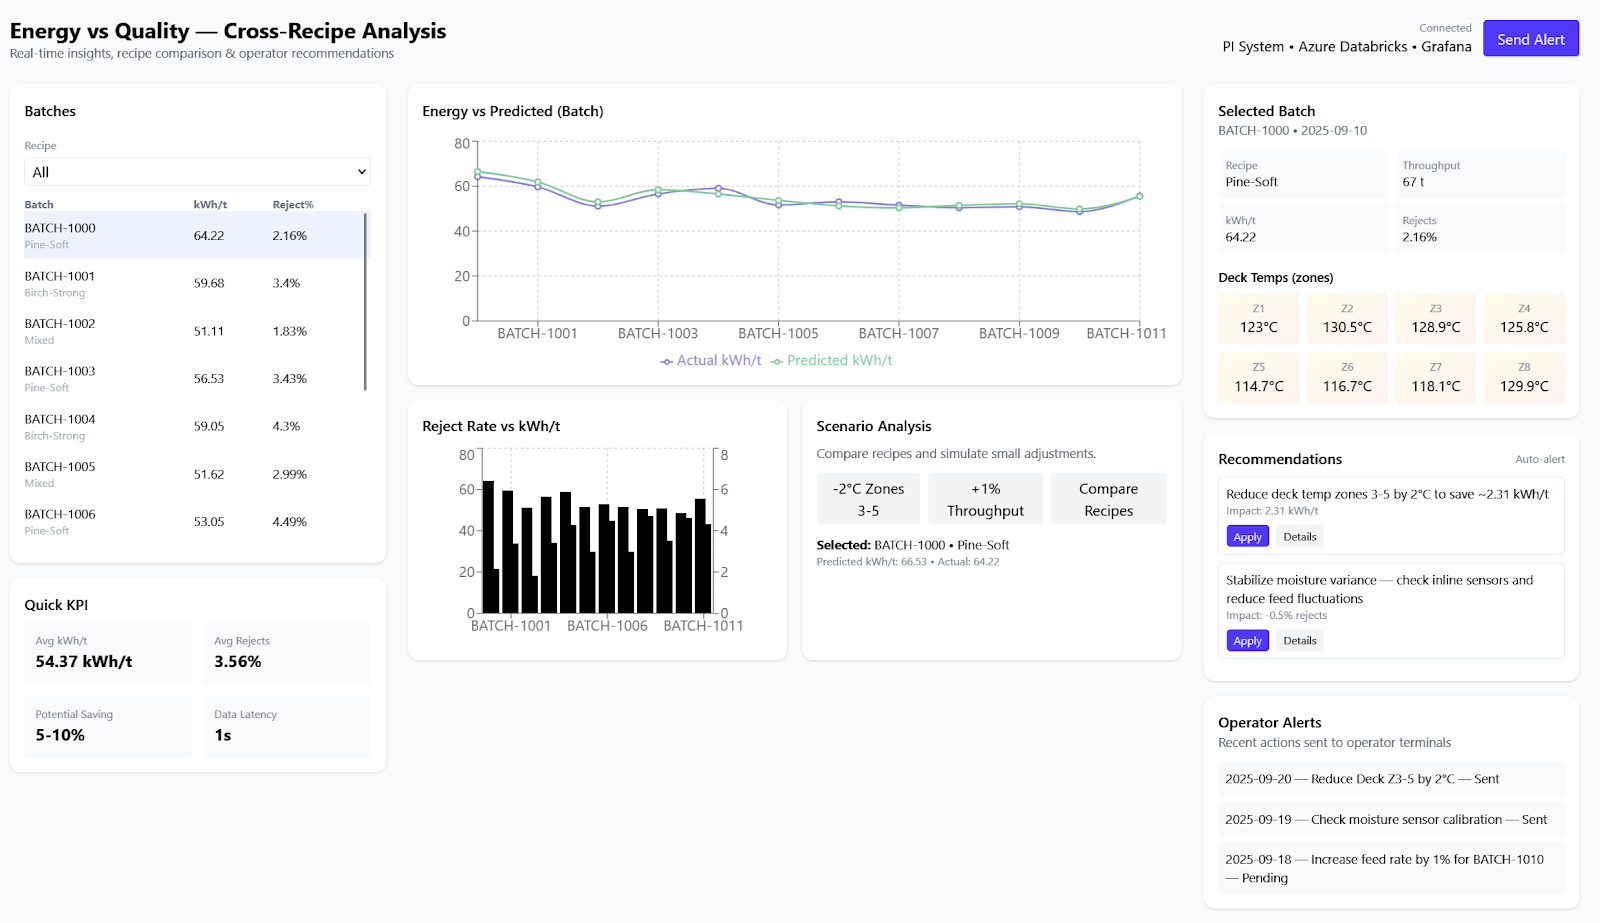
Solution 5: Visualization and Operator Dashboards
We built intuitive Grafana dashboards to present complex analytics in an actionable format:
- Batch-Level Insights: Energy consumption, predicted vs actual, and batch-level reject rates.
- Deck Temperature Heatmaps: Visual correlation between zones and energy/quality metrics.
- Alerting Mechanism: Actionable operator alerts, e.g., “Reduce Deck Temp by 2°C in zones 3–5 to save 3 kWh/t.”
By combining visualization, prediction, and recommendation, operators could respond quickly to sub-optimal conditions while understanding the reasoning behind each suggestion.
Solution 6: Real-Time Deployment
The full system supported real-time batch predictions via Azure Databricks:
- Data Flow: PLC → Edge → OPC UA → PI Historian → Azure Data Lake → Databricks for scoring → PI AF → Grafana dashboards.
- Integration: Operator alerts displayed directly on dashboards; model recommendations updated per batch in real-time.
- Scalability: The architecture allowed easy extension to additional press lines or new recipes, ensuring long-term operational benefit.
Key Results and Business Value
- Energy Savings: Optimized settings reduced energy consumption per ton by 5–10% across press lines, translating to significant cost savings and improved sustainability.
- Reduced Rejects: Batch-level rejects decreased by 2–3% under sensitive moisture or temperature conditions, maintaining product quality while optimizing energy usage.
- Data-Driven Operator Guidance: Operators received recipe-specific, actionable insights, replacing generic heuristics with precise recommendations.
- Enhanced Operational Analytics: The dashboards provided real-time visibility into energy consumption, deck temperature profiles, and quality outcomes, enabling continuous process improvement.
Payback Period: Total Initial Investment / Net Annual Savings = $155,000 / $116,250 = approximately 1.2 years (or about 14 months)
Features Delivered
- Real-Time Data Integration: Aggregated heater power, deck temperature, moisture, and quality data from multiple PLCs and sensors.
- Feature Engineering Pipeline: Batch-level metrics including energy per ton, temperature profiles, and moisture statistics, correlated with reject rates.
- Predictive Modeling and Recommendation Engine: XGBoost regression for energy prediction and scenario-based batch recommendations.
- Operational Dashboards: Grafana visualizations with batch-level and fleet-level insights, heatmaps, and operator alerts.
The veneer press energy optimization project demonstrates the potential of advanced analytics and machine learning in industrial manufacturing. By integrating real-time data from heaters, thermocouples, moisture sensors, and quality scanners, transforming it into actionable batch-level features, and deploying predictive models with a recommendation engine, the client achieved:
- 5–10% energy reduction per ton,
- 2–3% reduction in batch-level rejects, and
- actionable, recipe-specific guidance for operators.
This case illustrates how data-driven process optimization can deliver tangible business and operational benefits, transforming complex, heuristic-driven industrial workflows into measurable, repeatable, and sustainable performance improvements.
TECHNICAL DETAILS
Data Collection & Sources
Heater Power (Heater.kW) is collected directly from Siempelkamp ContiRoll S7-1500 PLC modules with SM 1234 analog input cards, sampled at 1-second intervals. The data is connected to the historian via PROFINET, then through the Edge Gateway to the PI System.
Deck Temperature (Deck.Temp[]) is measured using multiple thermocouples installed across the press decks. These are sampled via Siemens ET 200SP temperature modules at a 1-second frequency. The Edge Gateway aggregates these readings into array vectors per batch.
Veneer Moisture is monitored using inline moisture sensors (Siempelkamp Moisture Analyzer, contact brush type) with 0.5% accuracy. The output for each sheet is stored via a PLC tag, transferred through OPC UA, and recorded in the historian. The ROSI Score / Reject Rate comes from a post-press quality scanner (ROSI inline scanner, 1–2 mm resolution). The scanner provides per-sheet defect metrics, which are aggregated to determine the batch-level reject rate. This information is logged directly into the historian via Siemens S7, OPC UA, and PI AF.
Feature Engineering
Feature engineering includes calculating Energy per Ton (kWh/t) as EnergyPerTon = Throughputₜ ∑ Heater.kW ⋅ Δt, where Δt represents 1-second intervals and Throughput is measured in tons.
Temperature profiles are derived by aggregating the mean, maximum, minimum, and standard deviation across all deck zones per batch. The gradient between deck zones (ΔTemp Deck[n] − Deck[n+1]) is also included as a feature.
Moisture features consist of the average moisture per sheet, deviation within the batch, and minimum/maximum values. These are correlated with the reject rate to detect sensitivity to moisture variations.
Batch and recipe context is captured using RecipeID as a categorical variable, along with operatorID and shift information.
Modeling Approach
The goal of the regression analysis is to predict energy consumption per ton while maintaining target quality. Gradient Boosting Regression (XGBoost) is used as the primary algorithm, with Elastic Net Linear Regression employed for benchmarking. The training dataset consists of approximately 12 months of historical batches, totaling over 5,000 batches. Input features include deck temperature metrics (Deck.Temp[]), heater power profiles (Heater.kW), veneer moisture (Veneer.Moisture), RecipeID, and throughput rate. The output is the predicted energy per ton.
For validation, an 80/20 train-test split is applied with cross-validation by batch. Performance metrics include RMSE (kWh/t), R², and comparison against actual kWh/t values. Feature importance from XGBoost highlights which deck zones or parameters most strongly influence energy consumption.
Optimization & Analytics
Scenario analysis and cross-recipe comparison involve calculating the predicted kWh/t for each recipe based on observed temperatures and moisture. These predictions are overlaid with reject rates to identify energy-efficient recipes that do not compromise quality.
The recommendation engine suggests adjustments to deck temperature profiles or feed rates and highlights batches with potential to reduce kWh/t by 5–10% without increasing the reject rate.
Visualizations are implemented using Grafana dashboards, showing batch-level energy versus predicted values with reject rates overlaid. Heatmaps display deck temperatures in relation to energy consumption and quality.
Deployment
Inference is performed with real-time batch predictions using Azure Databricks integrated with the PI System Connector. The output generates operator alerts, such as “Reduce Deck Temp by 2°C in zones 3–5 to save 3 kWh/t.” The data flow follows three main steps: PLC data is transmitted via PROFINET to the Edge, then through OPC UA into the PI Historian. From there, PI data is extracted, transformed, and loaded into Azure Data Lake for model scoring in Databricks. The results are sent back into PI AF and visualized on Grafana dashboards, with alerts delivered directly to operators.


Our success stories


Tell us about your project needs


.png)