


The table of content
Introduction
Why hidden micro-stops matter
In many production lines, performance is still managed through high-level OEE numbers, coarse downtime codes, and occasional operator comments, even though a substantial part of the loss comes from short, fragmented interruptions rather than from long breakdowns. These micro-stops are typically too brief to be logged manually and too irregular to show up cleanly in standard reports, so they disappear inside slightly reduced line speeds, minor gaps in utilisation, and workarounds that operators adopt to keep output on target. As a result, management may see stable KPIs while real capacity is quietly lost, unit costs rise, and recurring problems at specific stations remain invisible.
Infinity Technologies operates precisely in this context, at the intersection of industrial operations and data, and has seen how often these “hidden” losses block further OEE improvement once the obvious downtimes are addressed. To tackle this, the company has developed Micro-stop Monitor, an automatic stop detection and classification solution that continuously reads PLC signals, identifies short, unplanned stops in real time, and assigns them to standardized, explainable reason codes. Instead of a vague picture of “some small stops during the shift”, factories get a transparent, continuous view of when and where micro-stops occur and why, which becomes a practical foundation for systematic, data-driven improvement rather than reactive firefighting.
Micro-stop Monitor: goal and scope
Micro-stop Monitor is the operational layer of the solution: its goal is to detect every micro-stop on a line in real time, classify it with a clear reason, and present this information in a form that operators and engineers can actually use during daily work. It focuses on turning raw PLC signals into concrete, line-level answers to four basic questions: what just stopped, where did it happen, how long did it last, and why did it occur. Instead of aggregating everything into coarse downtime codes once per shift, Micro-stop Monitor works continuously and at high temporal resolution, so that even very short interruptions become visible.
In terms of scope, Micro-stop Monitor covers three main responsibilities. First, it builds a virtual state machine from existing PLC tags and uses it to identify micro-stops as short RUN → READY-IDLE → RUN intervals when the line is technically able to run and material is present, but nothing is moving. Second, it applies deterministic, explainable rules to assign each detected stop to a standardized reason code, while keeping ambiguous events in an explicit UNKNOWN bucket that can later be reviewed. Third, it exposes live timelines, recent-event lists, and a compact dashboard with KPIs and Pareto by reason, so that hidden losses can be discussed in shift handovers, daily stand-ups, and quick improvement workshops.
By design, Micro-stop Monitor stays close to the line and to day-to-day operations. It does not try to replace long-term analytics or advanced ML models; instead, it provides a reliable, transparent foundation on which those higher-level tools can build. When deployed on a new line, it gives the team an immediate x-ray of micro-stops without requiring new sensors or large process changes, and it creates the structured event history that later enables deeper Micro-stop Analytics and machine-learning-based classification.
From PLC signals to micro-stops
To detect micro-stops reliably, the line must be described more precisely than just “running” or “stopped”. Instead of relying on a single run/stop bit, the system continuously reads a set of PLC tags that reflect motion, technical readiness, safety conditions, and material flow. These raw signals are combined into a compact virtual model of the line’s behaviour, which then forms the basis for a clear, auditable definition of what counts as a micro-stop.
Virtual state machine of the line
At the core of this model is a virtual state machine that represents the line in terms of a few derived states evaluated at each sampling step:
- Line_Running indicates whether key drives and transports are actually moving product.
- Machine_Ready summarizes infrastructure and fault bits (power, compressed air, general faults, overtemperature, etc.) to show whether the line could run from a technical standpoint.
- Safety_OK reflects the status of interlocks, safety fences, and other protective devices.
- Material_Present aggregates sensors that indicate whether there is work-in-progress in the relevant buffers and stations.
By combining these, the system assigns each moment in time to a macro-state such as RUN, READY‑IDLE, FAULT‑STOP, or NO‑MATERIAL. This abstraction hides low-level PLC differences but preserves the operational meaning of what the line is doing and what is preventing it from working.
Micro-stop definition and detection logic
On top of the state machine, a micro-stop is defined as a short interval where the line is ready and supplied but not moving. Concretely, a micro-stop:
- starts when the line transitions from RUN to READY‑IDLE while Machine_Ready, Safety_OK, and Material_Present remain true;
- ends when the line transitions back from READY‑IDLE to RUN;
- has a duration between a configurable minimum and maximum (for example, 5–180 seconds), so that normal cycle pauses and long downtimes are excluded.
During this interval, the readiness and safety conditions must be satisfied for most of the time; if they drop for longer than an allowed percentage, the event is treated as a different type of stop (fault, safety) rather than as a micro-stop. This transition-based logic ensures that only the meaningful “could run but doesn’t” intervals are captured, and that each captured micro-stop can be traced back to specific state changes in the virtual model, making detection both robust and explainable.
Rule-based classification of stop causes
Detecting that a micro-stop happened is not enough on its own; to drive improvement, each stop needs an understandable reason. Micro-stop Monitor therefore applies a rule-based classification layer that translates PLC signal patterns and station context into standardized cause codes. This makes the logic transparent: every assigned reason can be traced back to a concrete “if–then” rule and the signals that triggered it, rather than to a black-box algorithm.
If–then rules and priorities
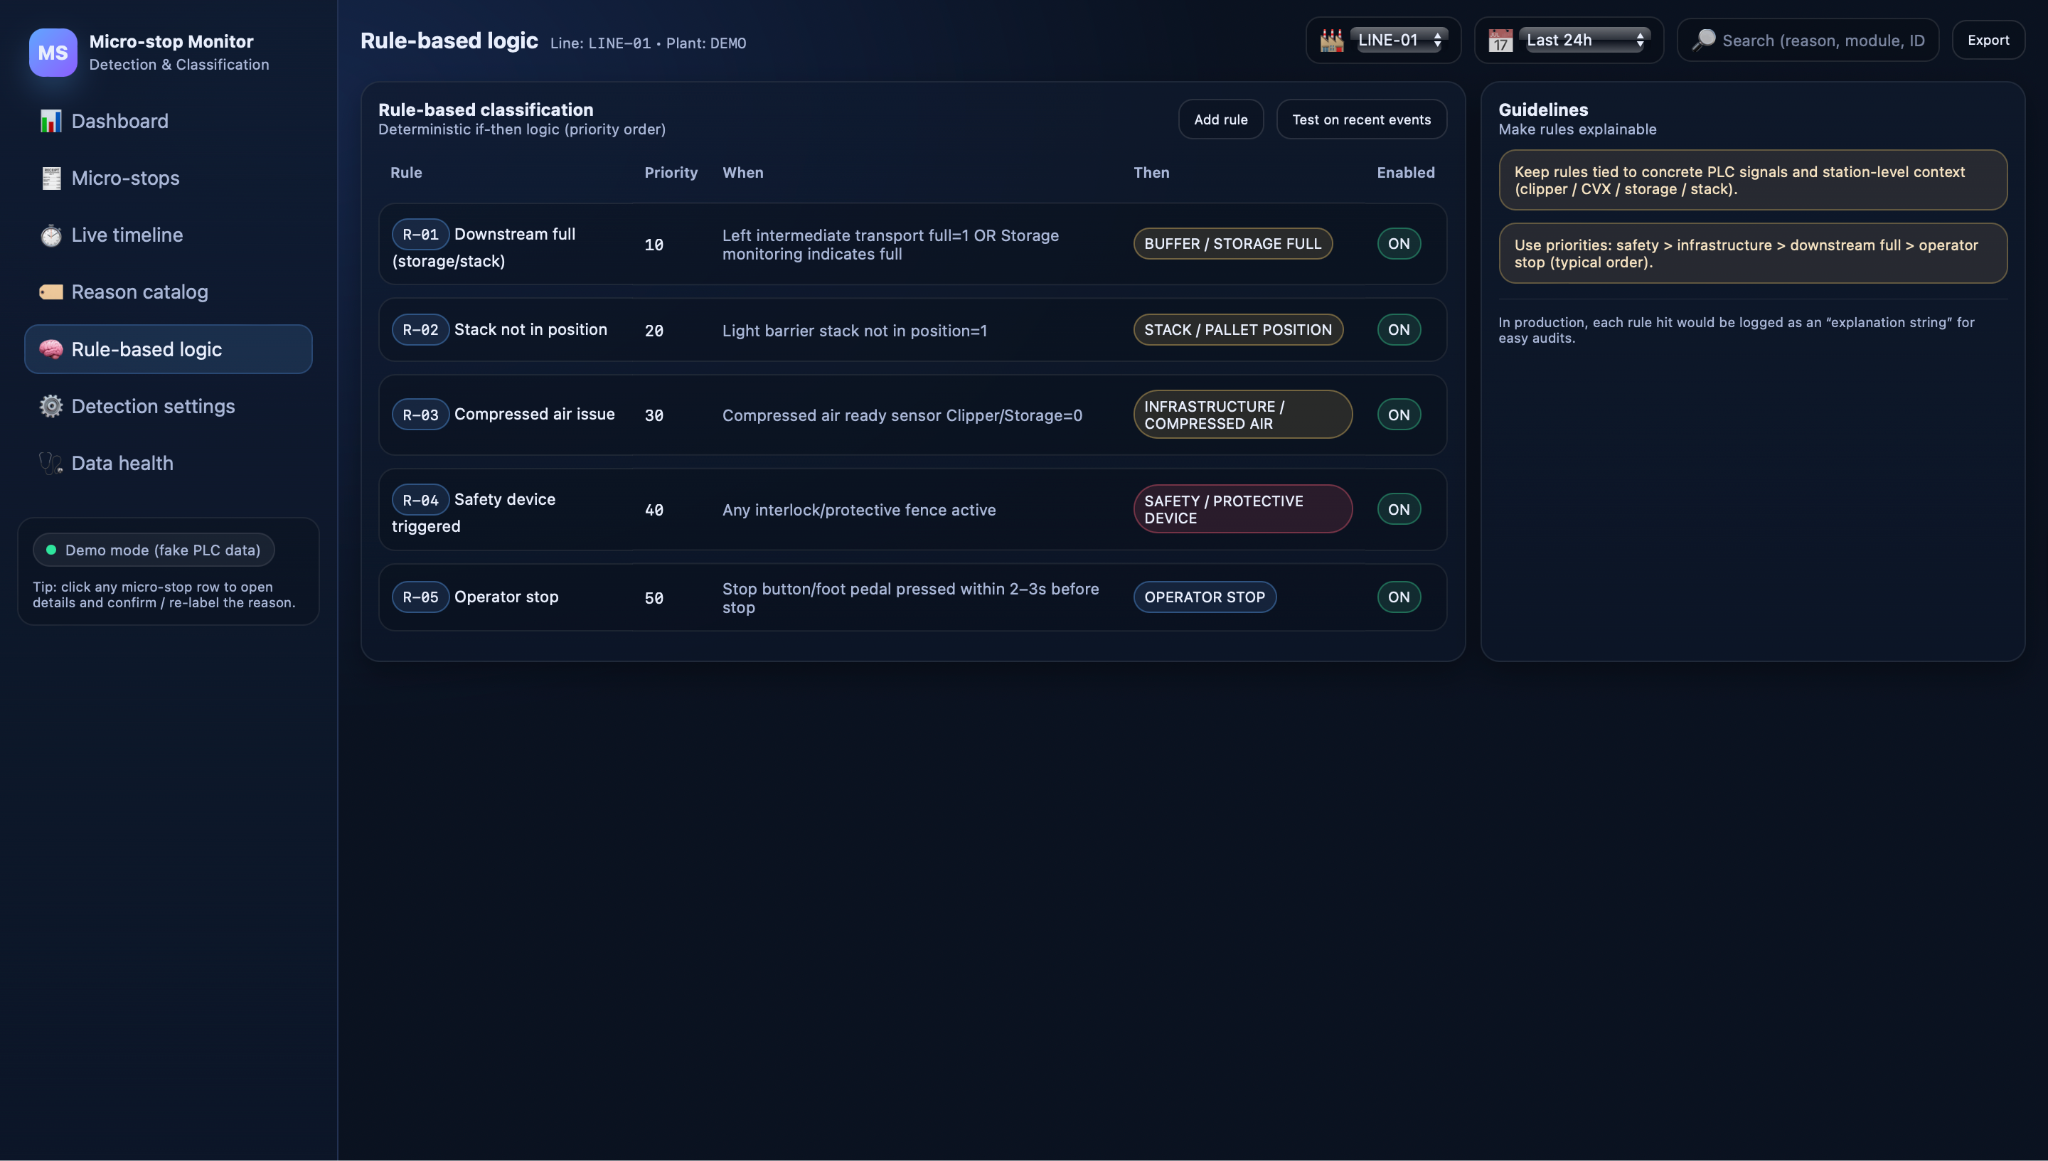
The classification engine uses a set of deterministic if–then rules that encode domain knowledge about the line. Each rule inspects relevant tags around the start of a micro-stop and, if its conditions are met, assigns a reason with high confidence. Typical examples include:
- Buffer/storage full – activates if buffer‑full or storage‑full signals are on and upstream motion stops, indicating downstream blocking.
- Stack/pallet position – fires when “stack not in position” or similar sensors detect a misaligned pallet near the time of the stop.
- Operator stop – triggers when a stop button or foot pedal is pressed shortly before the transition from RUN to READY‑IDLE, with no faults or safety signals active.
- Safety/protective device – applies when any interlock, safety fence, or protective plate signal is active.
- Infrastructure/compressed air – used when air‑ready or power‑ready signals drop and Machine_Ready goes false.
Rules are evaluated in a defined priority order so that more critical causes override less critical ones—for example, safety conditions take precedence over infrastructure, which in turn outrank downstream blocking or operator stops. This prevents conflicting rules from assigning multiple reasons to the same event and keeps the classification consistent and explainable.
Reason catalog and UNKNOWN bucket
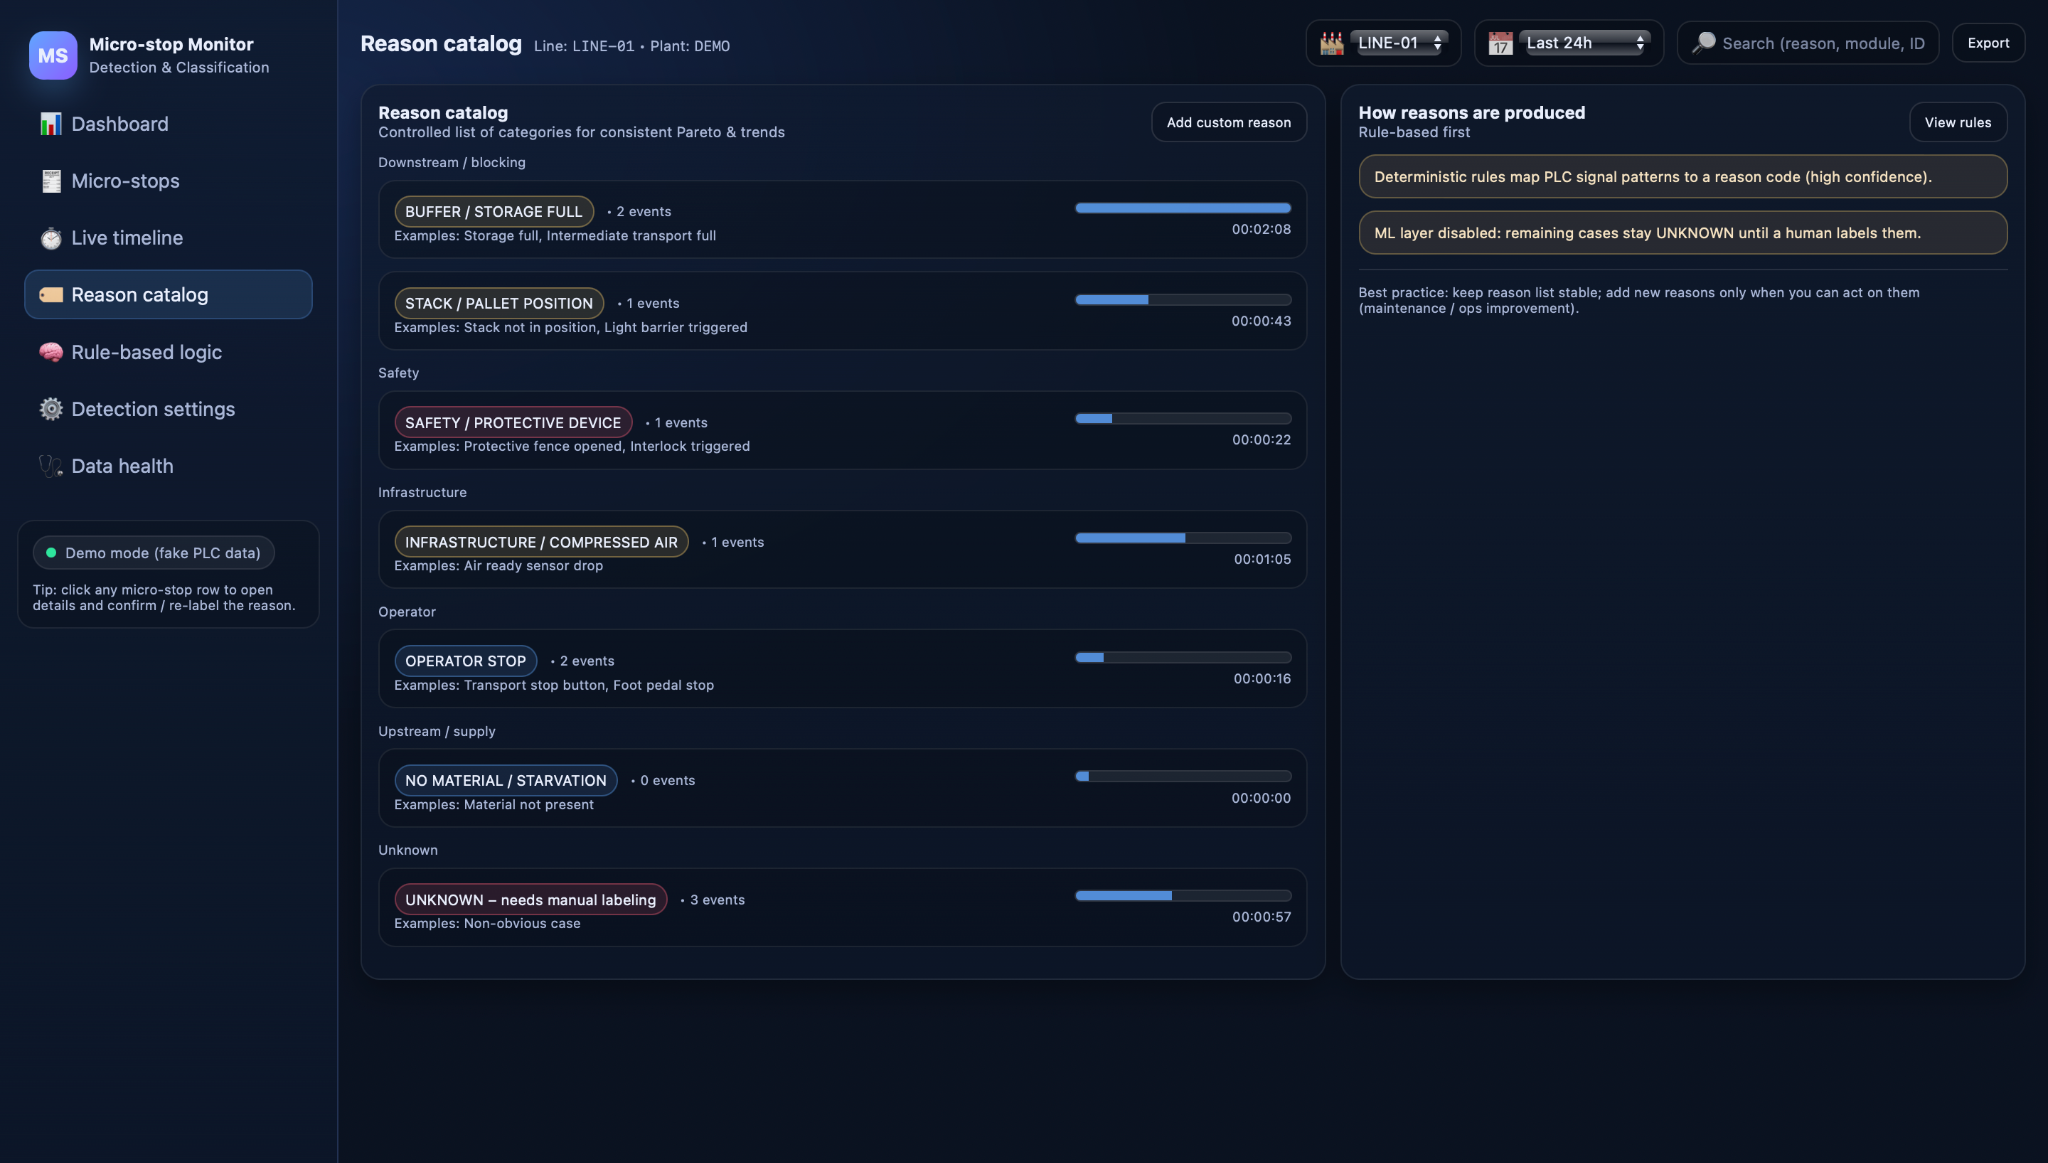
Instead of free-text descriptions, all rule outputs map to a controlled reason catalog. This catalog groups individual reasons into higher-level categories such as downstream/blocking, safety, infrastructure, operator, upstream/supply, and UNKNOWN. The catalog ensures that the same type of problem is always labeled in the same way, regardless of which rule fired or on which station it occurred, which is crucial for reliable Pareto charts and trend analysis.
Not every micro-stop will match a rule cleanly. When no rule applies with sufficient confidence, or when conditions are ambiguous, the event is deliberately placed into the UNKNOWN bucket. This avoids forcing a wrong explanation just to avoid gaps in the data. UNKNOWN stops are then highlighted for expert review and become a backlog for improving both the rules and, later, machine-learning-based classification. Over time, as new rules are added and models are trained, the share of UNKNOWN should decrease, while the catalog remains stable enough to support consistent reporting and comparison across lines and time periods.
Micro-stop Monitor in daily operations
Beyond detection and classification, Micro-stop Monitor is designed to fit into the daily rhythm of the plant: shift handovers, short daily meetings, and ongoing troubleshooting. It provides a live view of what is happening on the line right now, as well as a concise summary of micro-stop performance over the last hours or shifts, so that teams can react quickly and track whether their actions are working.
Live view of micro-stops
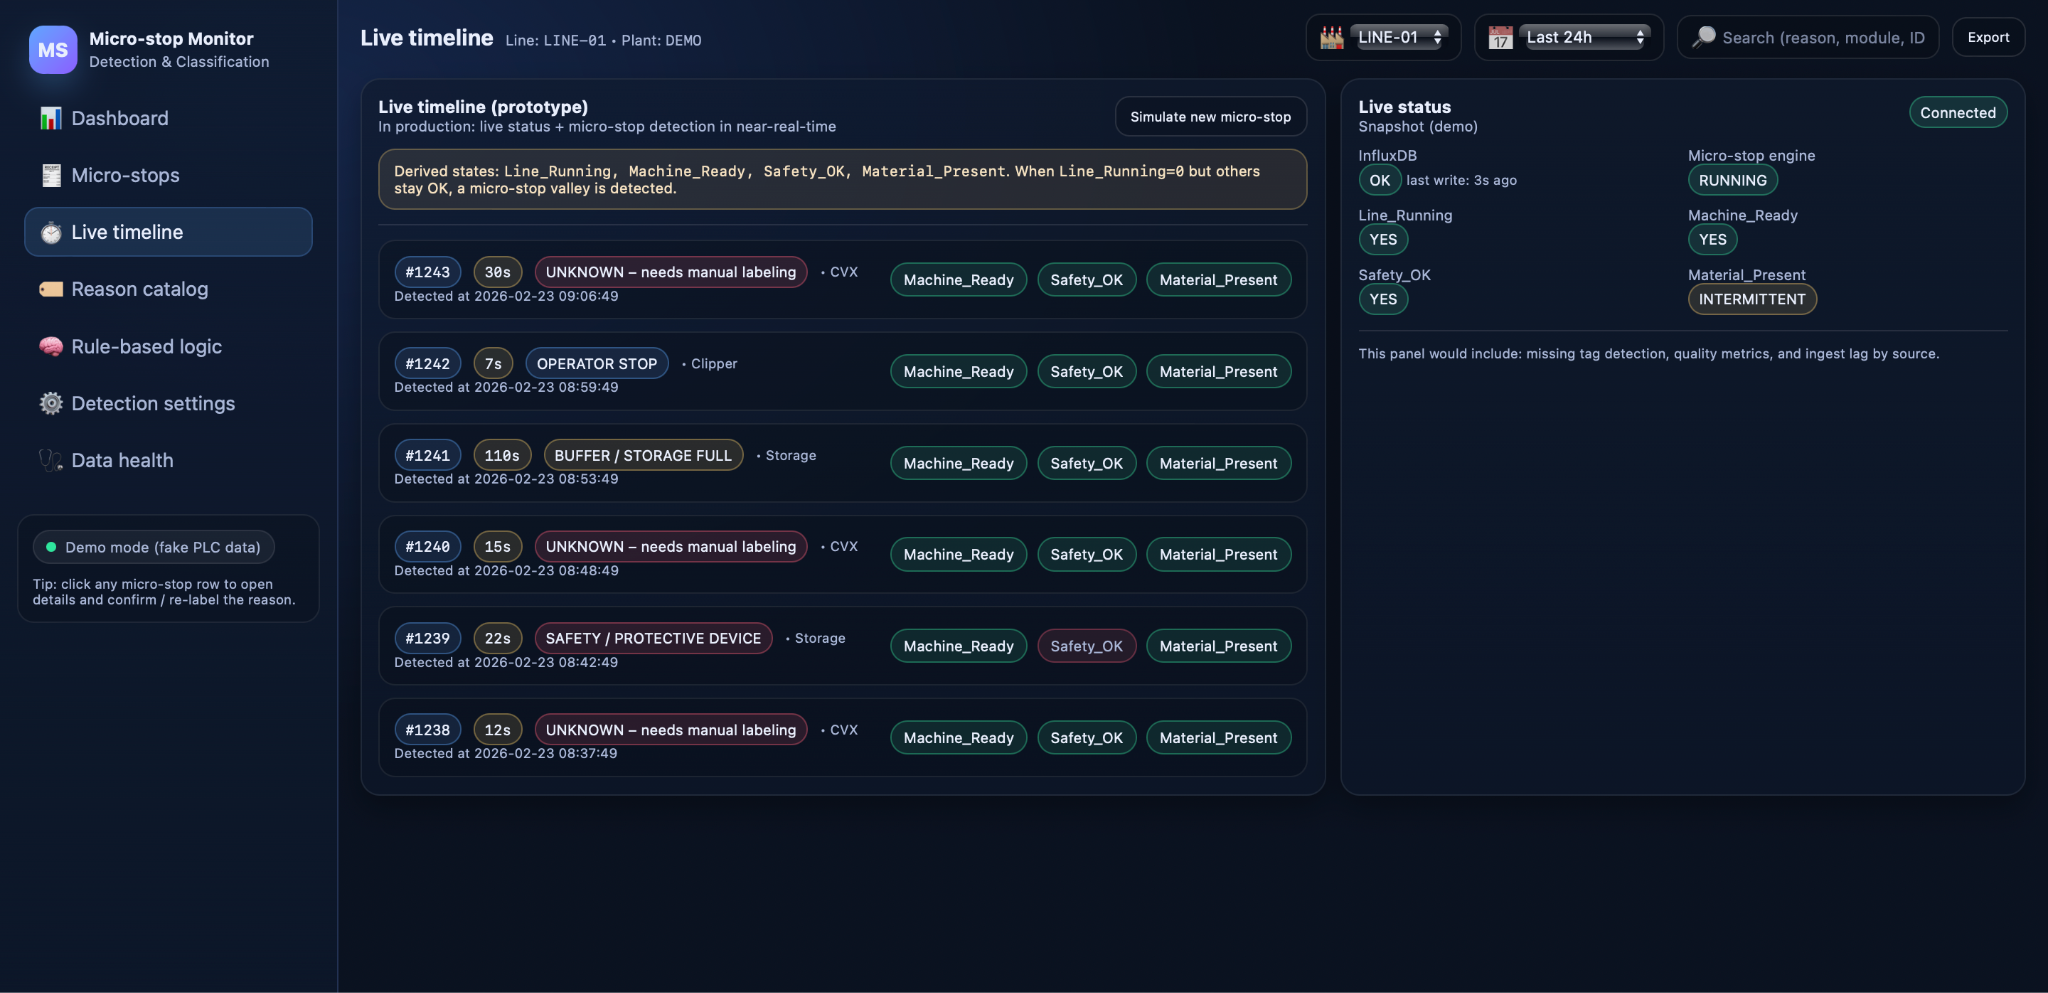
For real-time work, Micro-stop Monitor offers a live view that shows micro-stops as they are detected. Each new event appears with its start time, duration, station, and current reason, together with key derived states such as Machine_Ready, Safety_OK, and Material_Present. Supervisors can see within seconds whether a particular station is generating repeated buffer-full stops, whether operators are using manual stops excessively, or whether a new pattern of UNKNOWN events has emerged.
Alongside the timeline, a tabular list of recent micro-stops provides more structure for short-term analysis.
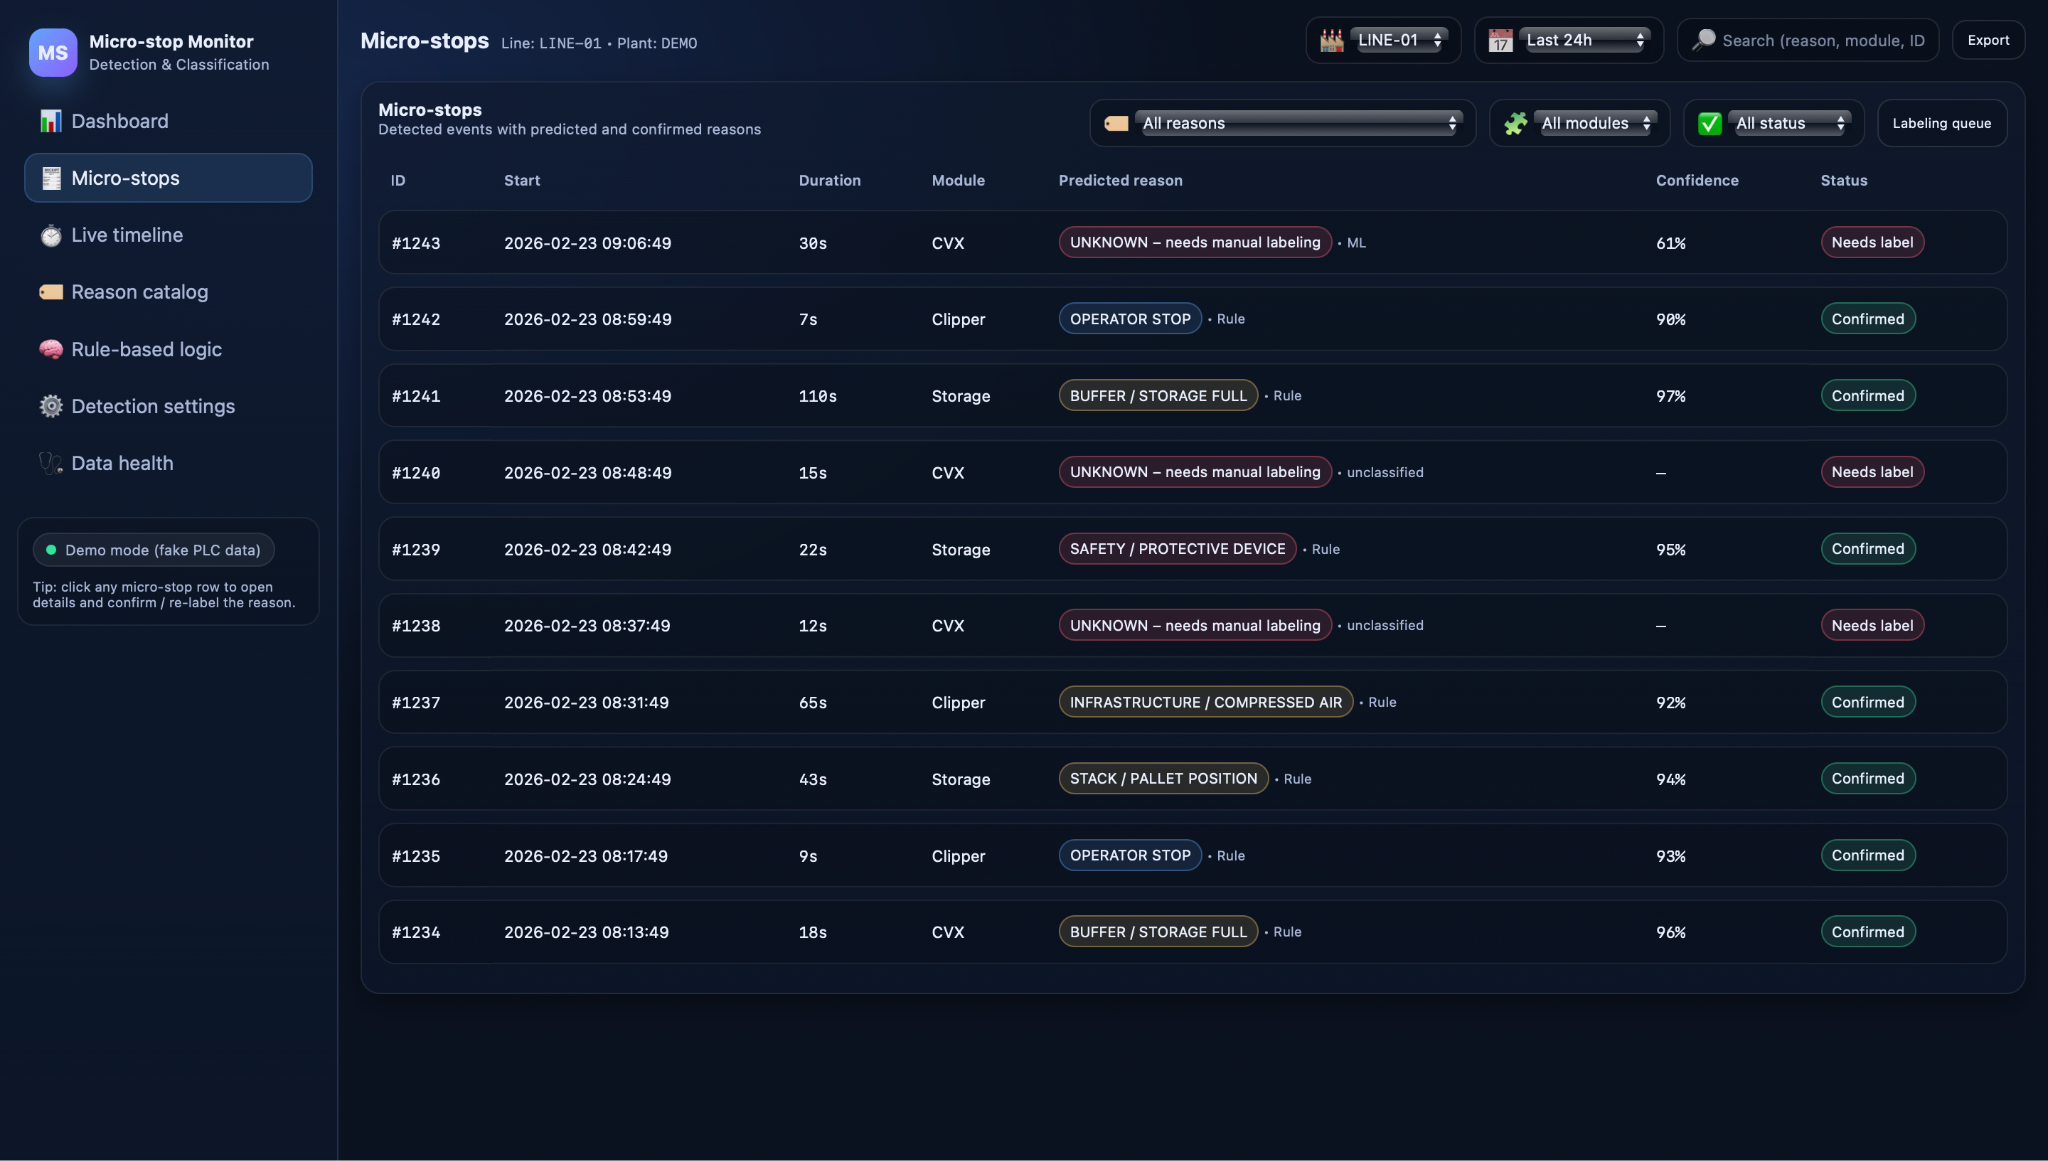
Here, events can be filtered by time window, station, or reason, and sorted by duration or confidence. This makes it easy, for example, to review all stops longer than one minute in the last shift or to focus on UNKNOWN events on a specific module. Together, the timeline and list give operators and engineers a shared, factual view of what has actually happened on the line during their shift.
Dashboard KPIs and Pareto by reason
For a slightly higher-level perspective, Micro-stop Monitor includes a compact dashboard that aggregates micro-stop data into a few key indicators.
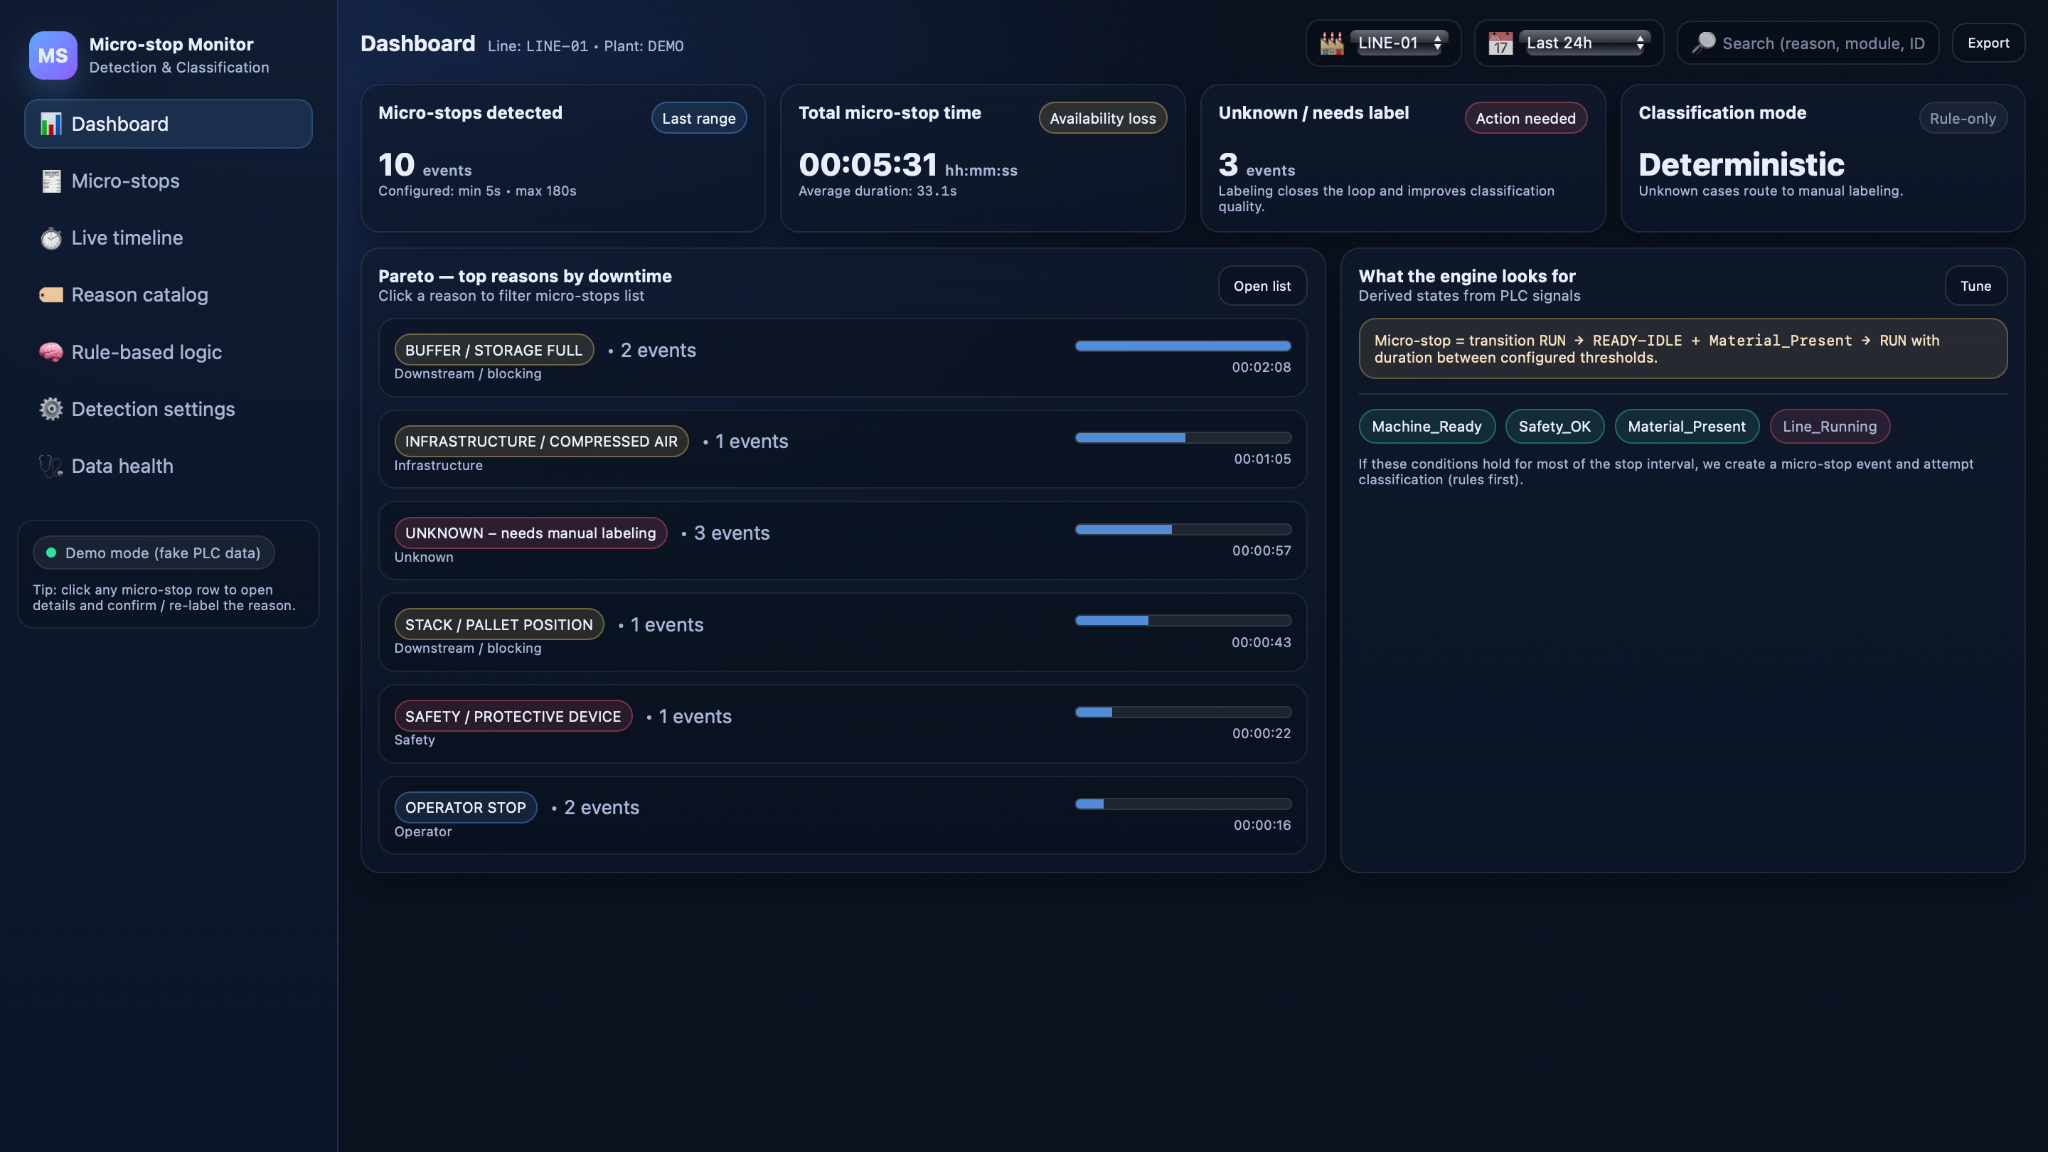
Typical KPIs include the number of micro-stops in the selected time range, total downtime from micro-stops, average event duration, and the count of events that still require labeling or review. These metrics answer at a glance whether the line is currently stable or experiencing an unusual amount of short interruptions.
The dashboard also shows a Pareto of downtime by standardized reason, based on the rule-based classification and, where available, confirmed labels. This view highlights which causes dominate micro-stop losses on the line—for example, whether STACK / PALLET POSITION, BUFFER / STORAGE FULL, or OPERATOR STOP is currently the main issue. In daily or weekly meetings, teams can use this Pareto to choose one or two top reasons to address, then monitor in subsequent periods whether the corresponding bars shrink. In this way, Micro-stop Monitor supports a simple but effective improvement loop directly connected to day-to-day operations.
Technical foundation and rollout
Micro-stop Monitor is built as a lightweight, modular pipeline from PLC signals to line-level insights. Its technical design separates high-frequency signal logging, micro-stop detection, event storage, and visualisation, so that each layer can be maintained and scaled independently while keeping the overall system simple to understand.
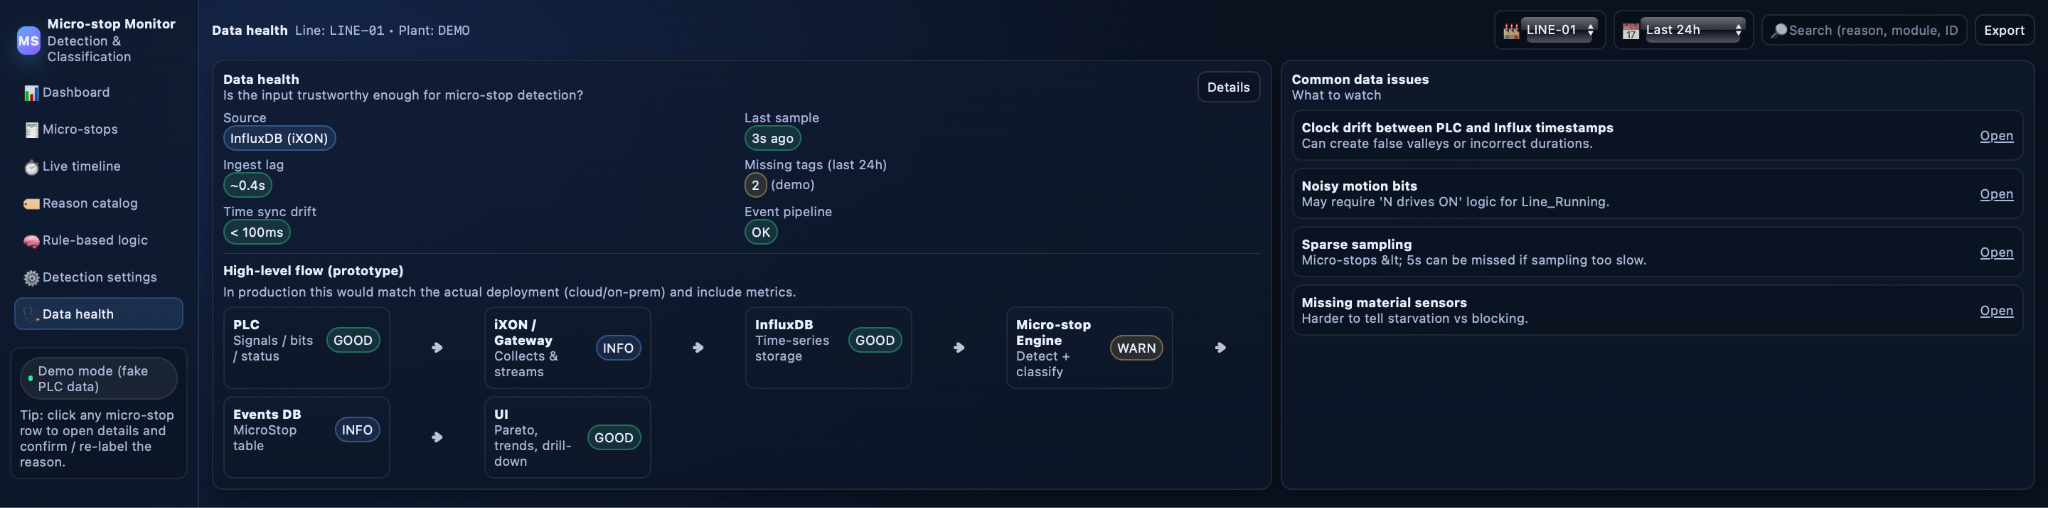
Data flow and data-health checks
On the data side, selected PLC tags—motion bits, readiness and safety signals, material presence, operator actions—are streamed into a time-series store where they are captured with precise timestamps. A detection engine reads short time windows from this store, computes the virtual state machine, detects micro-stops, and assigns reasons, then writes each stop as a structured event into an operational database used by the Micro-stop Monitor UI. To keep results trustworthy, a dedicated data-health layer tracks ingest lag, clock drift between PLC and server, missing tags, and pipeline status, and surfaces issues such as sparse sampling or noisy bits that could distort micro-stop durations or create false events.
Implementation steps and expected benefits
Rolling out Micro-stop Monitor on a new line typically follows a few clear steps. First, the team defines the micro-stop scope and selects the relevant PLC tags, then configures the virtual state machine and detection thresholds so that the line’s behaviour is captured correctly. Second, the main rule-based reasons are implemented and validated against real data, while the dashboard and live views are introduced to operators and engineers. Finally, thresholds and rules are tuned based on feedback from the first weeks of operation, and UNKNOWN events are reviewed to identify gaps in logic or instrumentation.
Even in this initial, rule-based phase, plants usually gain three immediate benefits: a transparent view of where and why short stops occur, faster troubleshooting because the sequence of events is visible without manual log digging, and a more focused improvement process guided by Pareto charts rather than by subjective impressions. At the same time, the event history produced by Micro-stop Monitor lays the groundwork for the second article’s topic—Micro-stop Analytics with deeper analysis and ML-based classification.
Conclusion and next steps
Micro-stop Monitor shows that significant performance gains can be unlocked not only by reducing major breakdowns, but also by systematically addressing the many short interruptions that normally stay invisible. By combining a virtual state machine, rule-based classification, and simple but powerful views (live timeline, events list, and line-level dashboard), it turns raw PLC signals into a continuous stream of explainable micro-stop events. This gives operators and engineers a shared factual basis for discussion and action, rather than relying on coarse downtime codes or memory of what happened during the shift.
As a next step, factories that deploy Micro-stop Monitor can use it to stabilise detection and build confidence in the reason catalog, while embedding micro-stop reviews into daily and weekly meetings. Once the event history is rich enough and UNKNOWN cases are systematically reviewed, they are in a strong position to adopt the second part of the solution: Micro-stop Analytics with deeper historical analysis, cross-line comparisons, and ML-based classification. Together, these layers move the organisation from reactive firefighting toward a continuous improvement loop grounded in detailed, trustworthy data about how the line really behaves.


Our success stories


.avif)


Tell us about your project needs


.png)
.png)