Full OEE and Lost‑Hours Analytics for the FC + CVX Line

AI/ML
IoT
Web Development
About the Task
Transform raw PLC and MES data into a virtual state model with second-by-second OEE, downtime classification, and bottleneck analytics
results
Full transparency of Availability, Performance, and Quality with precise breakdown of lost hours by category, shift, and module
results
Increased net productive time and enabled data-driven decisions without additional hardware investment
Services used
Build Product
Build Strategy
Web Development

The table of content

Introduction

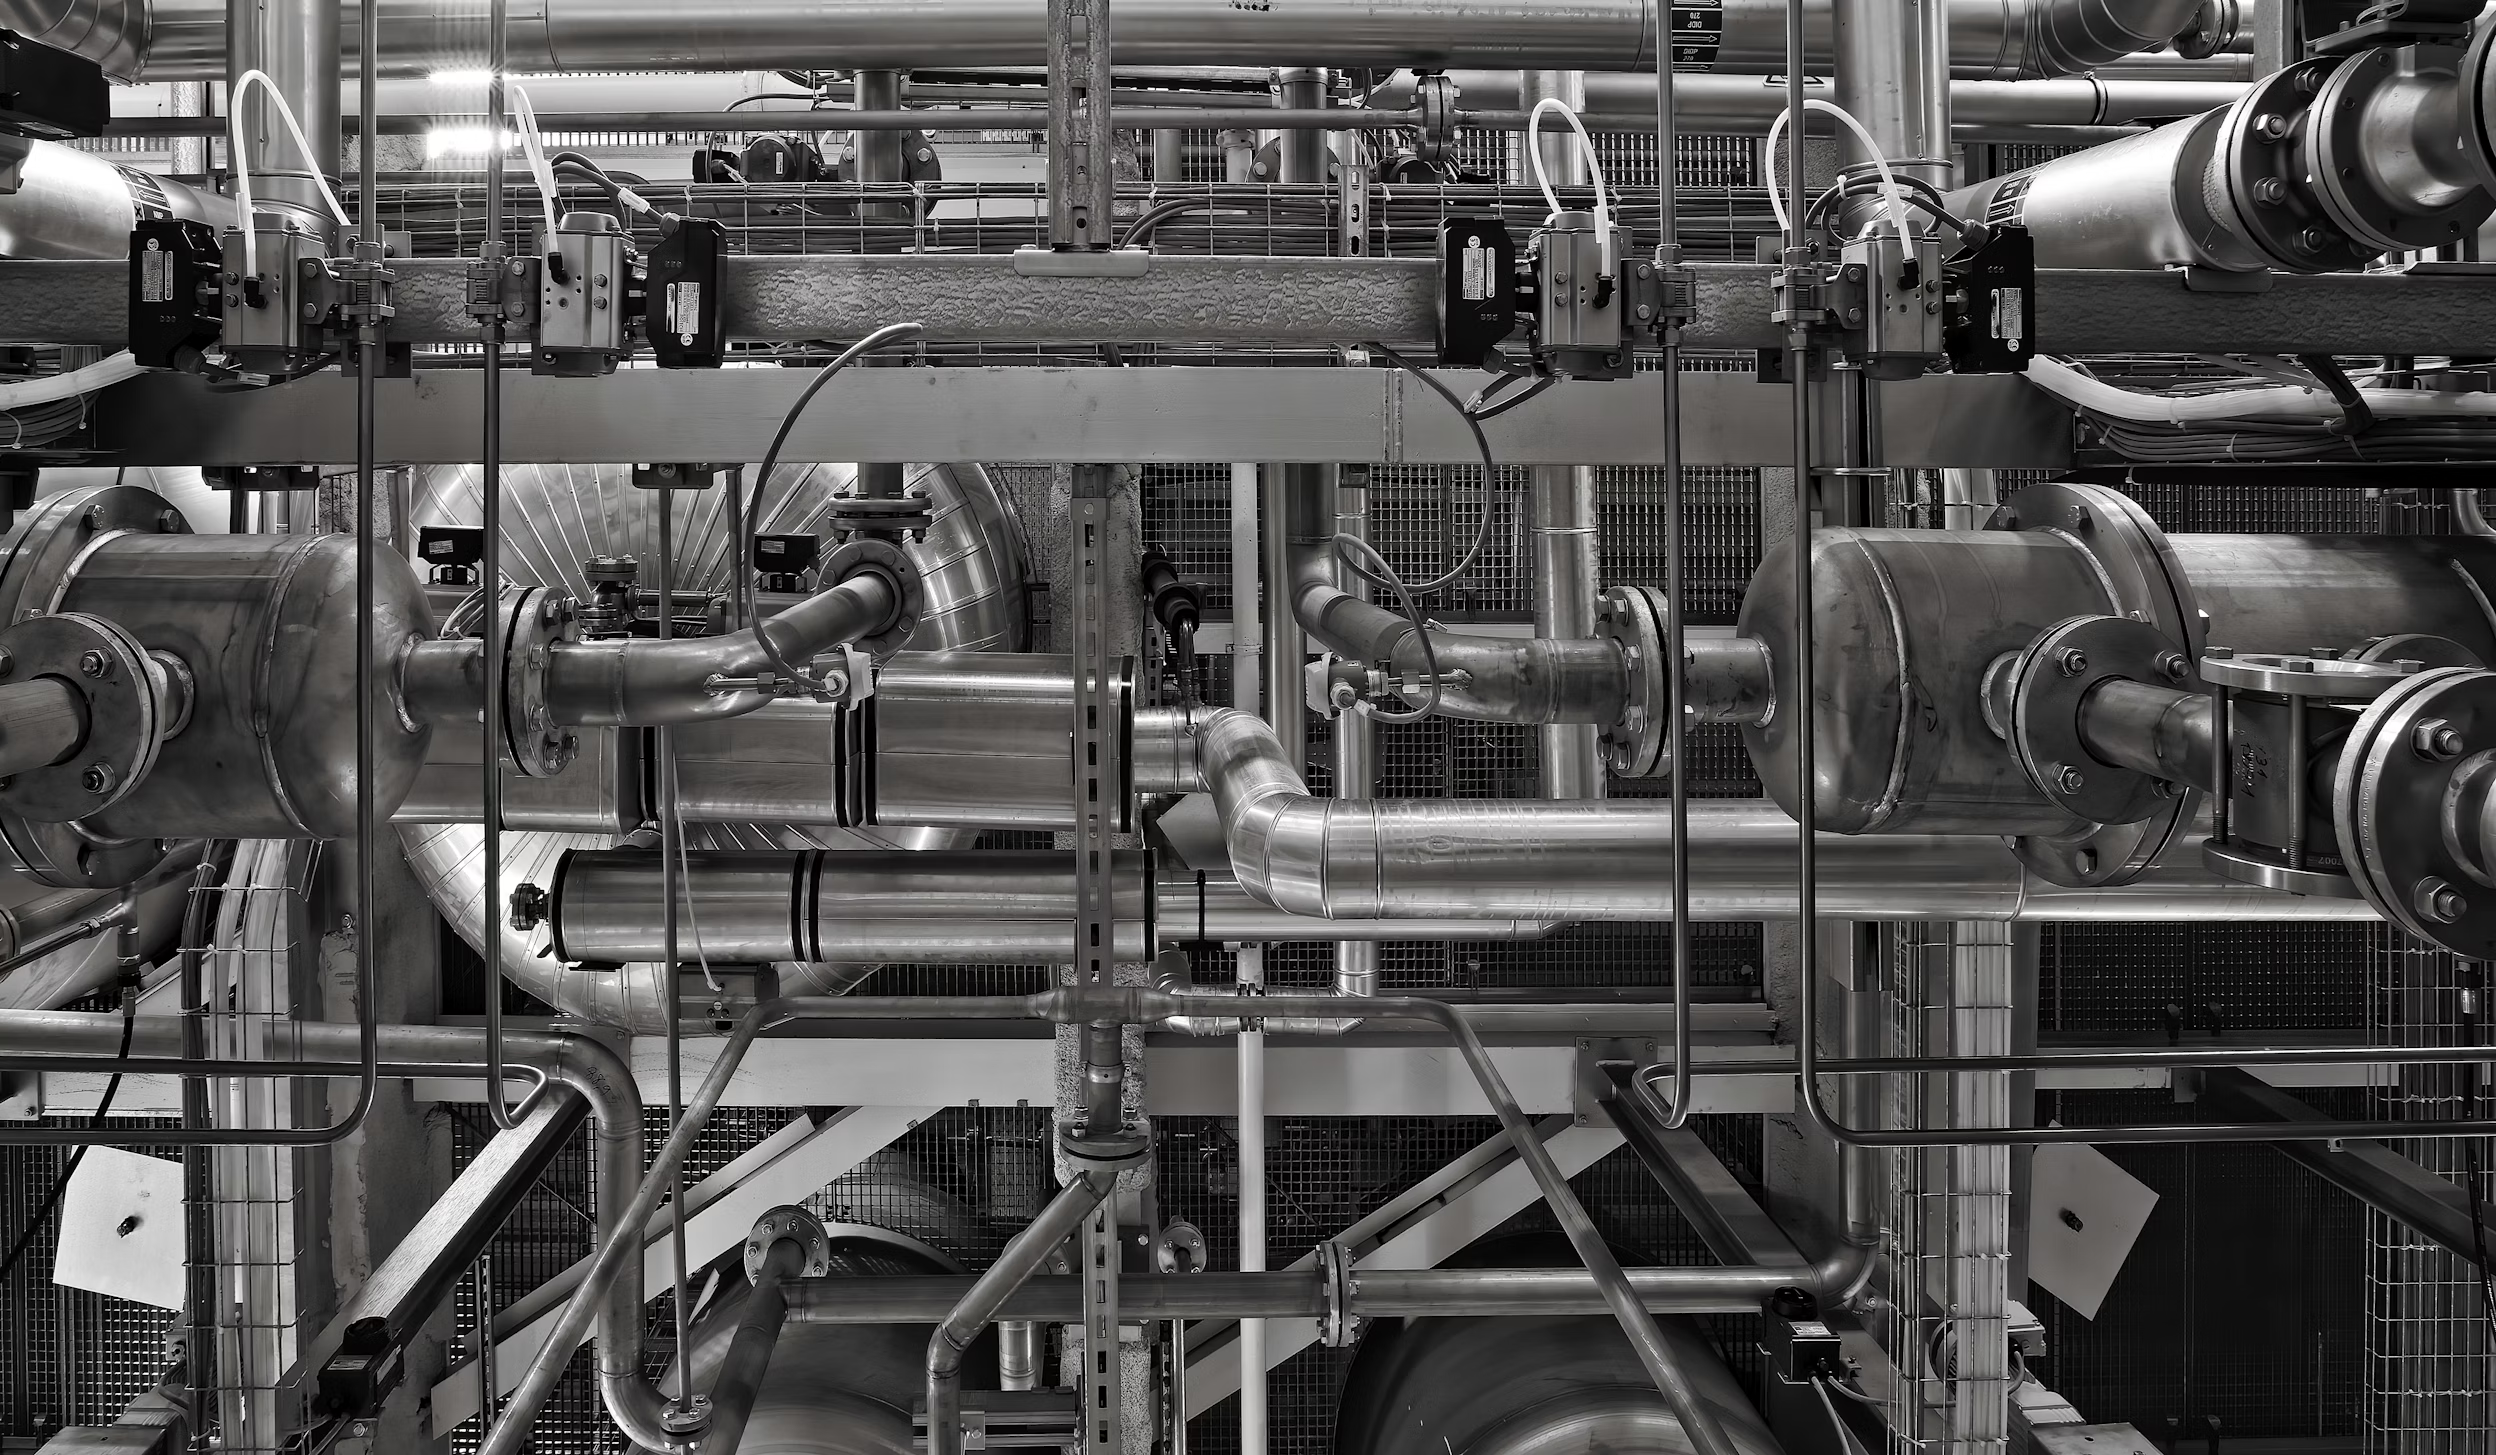
The FC + CVX line is a high‑throughput veneer production line where multiple modules (Clipper, CVX, intermediate conveyors, storage, stacker) must work in tight synchronisation to deliver stable output at the planned speed. Even small disturbances in availability, performance, or quality can quickly accumulate into hours of lost productive time, yet in many plants the only visible metric is a single OEE value at the end of the day or shift. Traditional reports from MES or spreadsheets provide aggregated numbers but do not explain where exactly time is lost, whether the line is starved of material, blocked by full buffers, waiting for an operator, or stopped by technical faults. This creates a gap between the complexity of the equipment and the simplicity of the KPIs used to manage it, making it hard to identify real bottlenecks and to agree on priorities between production, maintenance, and management.

The purpose of this use case is to close that gap by turning raw PLC signals from the FC + CVX line into a transparent, second‑by‑second view of how the line is used, and by clearly quantifying all “lost hours” inside planned production time. The solution builds a consistent OEE model that calculates Availability, Performance, and Quality for every shift, day, product, and module, while also breaking down downtime into meaningful categories such as No Material, Blocked, Changeover, Maintenance, Fault, and Operator Break. For management, this provides a single source of truth to understand where efficiency is gained or lost and to justify investments with data. For maintenance, it separates technical issues from organisational and material‑related stops, supporting preventive actions and better planning. For operators and shift supervisors, the dashboards become a daily tool that shows how their decisions and reactions affect OEE in real time and highlights concrete opportunities to increase output without new machinery.

Data and Virtual State Model

The use case builds on data that already exists in the customer’s automation and production systems and organises it into a consistent virtual view of how the FC + CVX line behaves over time. At the base layer are detailed PLC signals from all main modules of the line, including drives, transports, shears, buffers, stackers, infrastructure readiness, safety circuits, material presence, and operator commands; this is enriched with production orders, shift calendars, and quality information provided by MES or ERP systems. Together, these inputs describe not only whether the machine is electrically and pneumatically ready, but also whether material is present at each critical point, whether buffers are full, whether safety devices are active, and what product and speed targets apply in a given period.

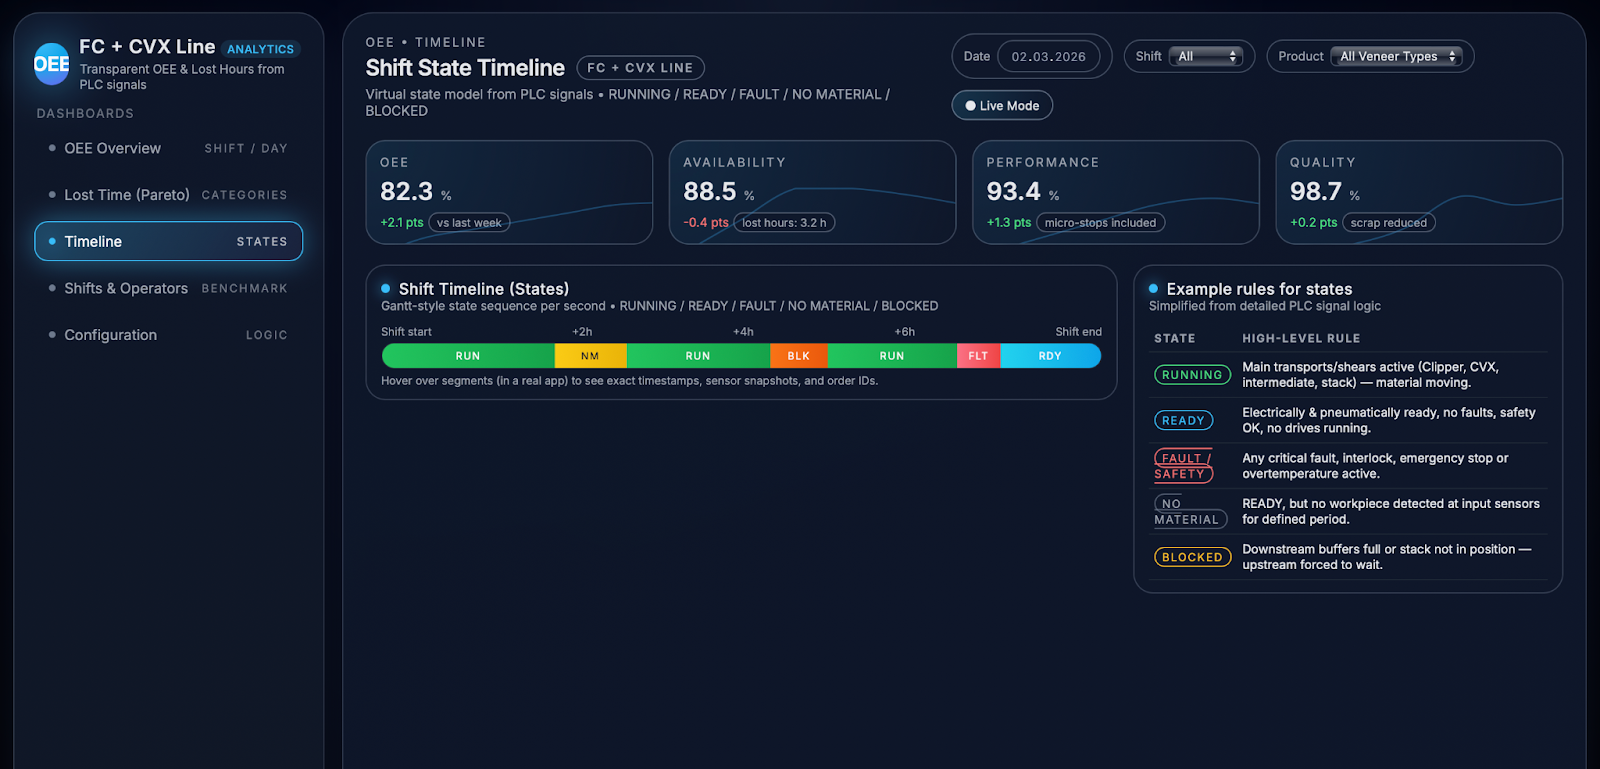
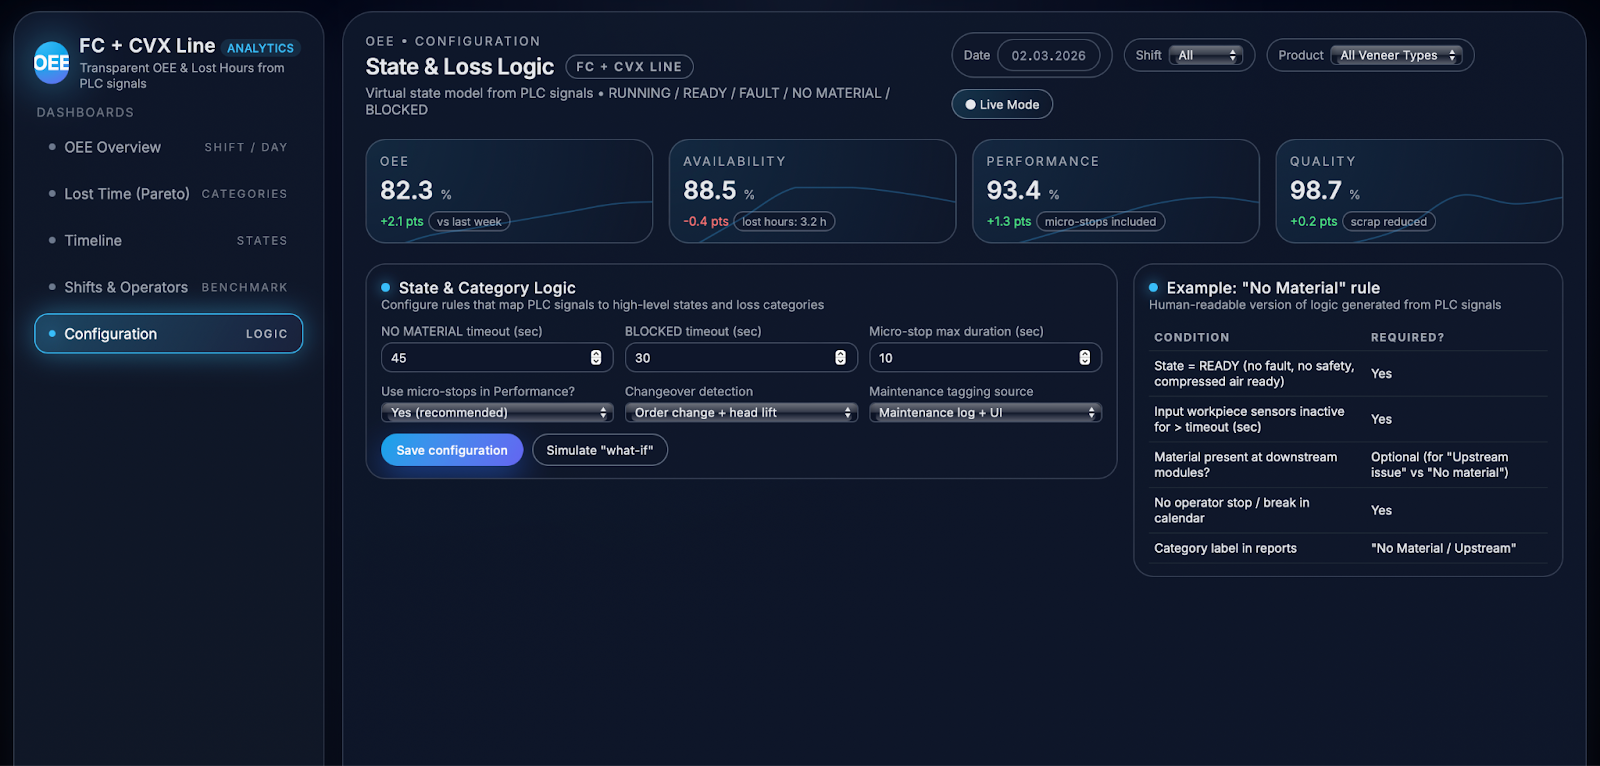
To make this information usable for operations, the solution constructs a virtual state model that classifies every second of line behaviour into a small number of high‑level states: RUNNING, READY, FAULT, NO MATERIAL, and BLOCKED. RUNNING covers all moments when at least one of the main transports or shears is actively moving material; READY indicates that the line is technically ready (power, compressed air, safety all OK) but no drives are running; FAULT represents any critical fault, interlock, or safety stop; NO MATERIAL captures periods when the line is READY but material sensors show no workpieces at the input for longer than a defined threshold; and BLOCKED describes situations where upstream sections are forced to wait because downstream storage or stack sensors indicate full buffers or “stack not in position”. These states provide a shared language that is easy to understand for operators, engineers, and managers.

Under the hood, state transitions are driven by explicit rule logic that combines multiple signals, conditions, and timeouts so that states remain stable and meaningful rather than flickering with every short sensor change. For example, the logic will only switch into READY when breaker and compressed‑air signals are healthy, HVAC and overtemperature alarms are clear, all safety fences and interlocks are closed, and no main drive is running; it moves into NO MATERIAL only if relevant input sensors remain inactive for more than a configured number of seconds, and into BLOCKED when downstream “buffer full” or “stack not in position” signals stay active beyond their timeout. Every resulting state is logged continuously, typically with a one‑second resolution, creating a time series that shows exactly how long the line spent in each condition, in which order states occurred, and how they align with orders and shifts. This continuous state history is the foundation for all subsequent analytics: it defines planned versus operating time, enables precise OEE calculation, powers Pareto breakdowns of lost hours, and drives visualisations such as timelines and benchmarking views.

OEE Calculation and Lost Hours Analytics

The analytics layer builds directly on the virtual state model to calculate OEE in a way that is both fully automated and easy to interpret in daily operations. Planned production time for each shift or day is derived from the production calendar, excluding scheduled breaks and planned maintenance, and defines the window in which OEE is evaluated. Within this window, operating time is defined as all periods when the line is RUNNING, plus optional micro‑stops that are short enough to be treated as part of normal operation rather than as separate downtime; the threshold for such micro‑stops can be tuned to each customer. Time spent in non‑productive states such as NO MATERIAL, BLOCKED, FAULT, MAINTENANCE, or longer operator‑related stops is excluded from operating time and instead contributes to “lost hours”, making the impact of each non‑running condition explicitly visible.

From this foundation, the system calculates the three OEE components for every relevant slice of the process: per shift, per day, per product, and per module of the FC + CVX line. Availability expresses the ratio between operating time and planned production time and is directly linked to the proportion of time spent in productive vs non‑productive states. Performance compares actual throughput against the ideal throughput derived from nominal or target speed per product, using workpiece detection sensors and counters to measure how many sheets or joints were actually processed in each interval. Quality is determined from customer data on good versus scrap output per period, synchronised with the same timeline as states and throughput. Combining these three components yields OEE as a single KPI for each time slice, but the dashboards always allow users to drill down into the underlying components and see how they evolve over time.

Within planned production time, any second when the line is not producing good output is treated as a potential “lost hour” and is classified according to the state model, sensor patterns, operator actions, and calendar context. The analytics engine examines all non‑RUNNING intervals and assigns them to clearly defined loss categories, turning diffuse impressions of “downtime” into measurable buckets of waste. Typical categories include No Material, where the line is READY but upstream sensors show no workpieces; Blocked, where upstream sections are waiting because downstream buffers or stacks are full or not in position; Operator Break / No Operator, where the machine is READY and material is present but no start command is given outside scheduled breaks; Changeover / Setup, where the line is intentionally stopped or running in special modes during order changes and alignment; Maintenance and Adjustment, where protective fences are open or interlocks are active in line with maintenance actions; Fault / Safety Stops, where the line is in FAULT due to technical or safety issues; and an Other category for intervals that do not yet match any rule and can be refined over time.

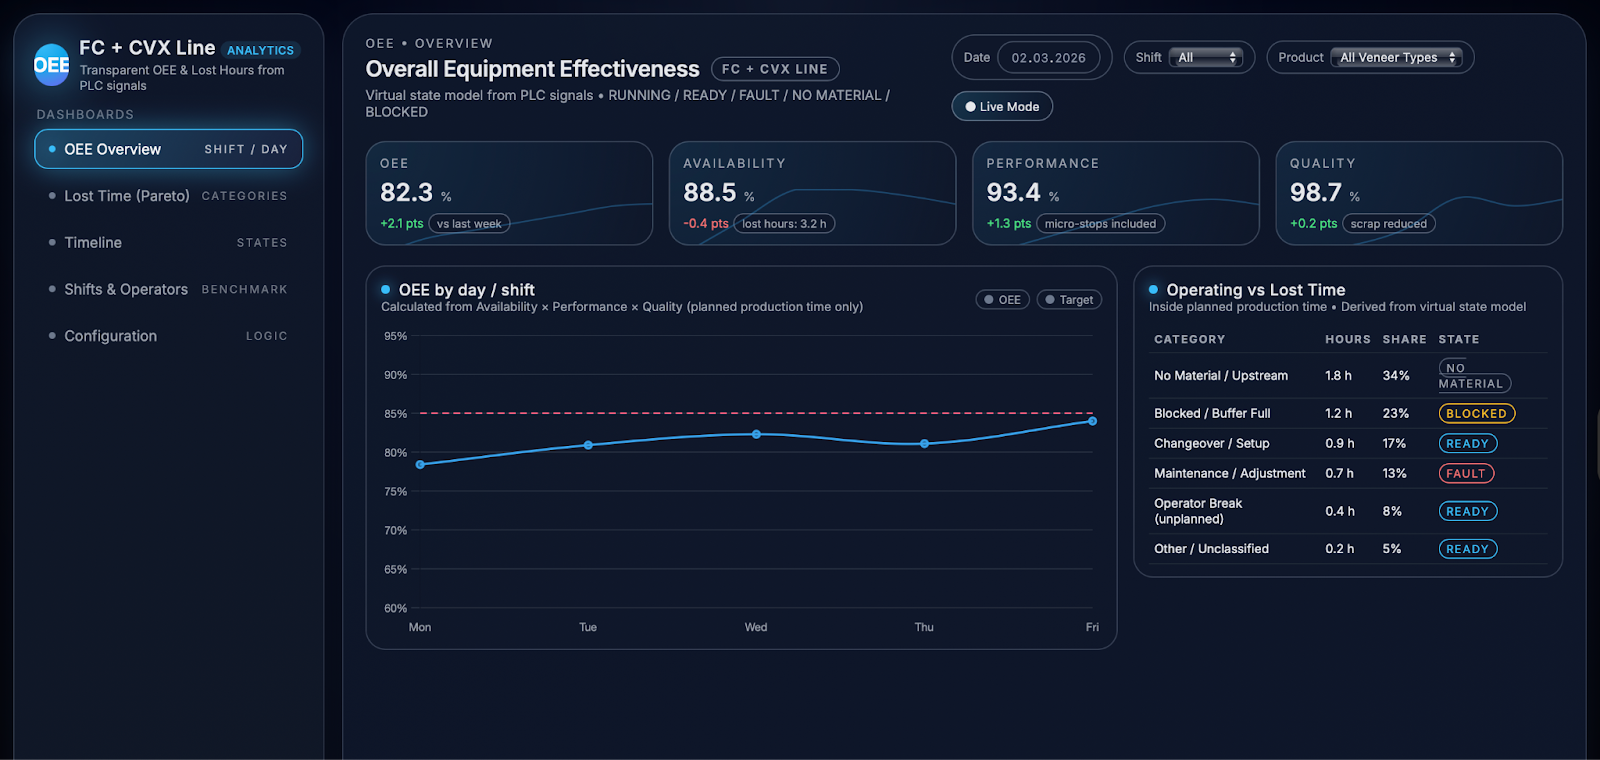
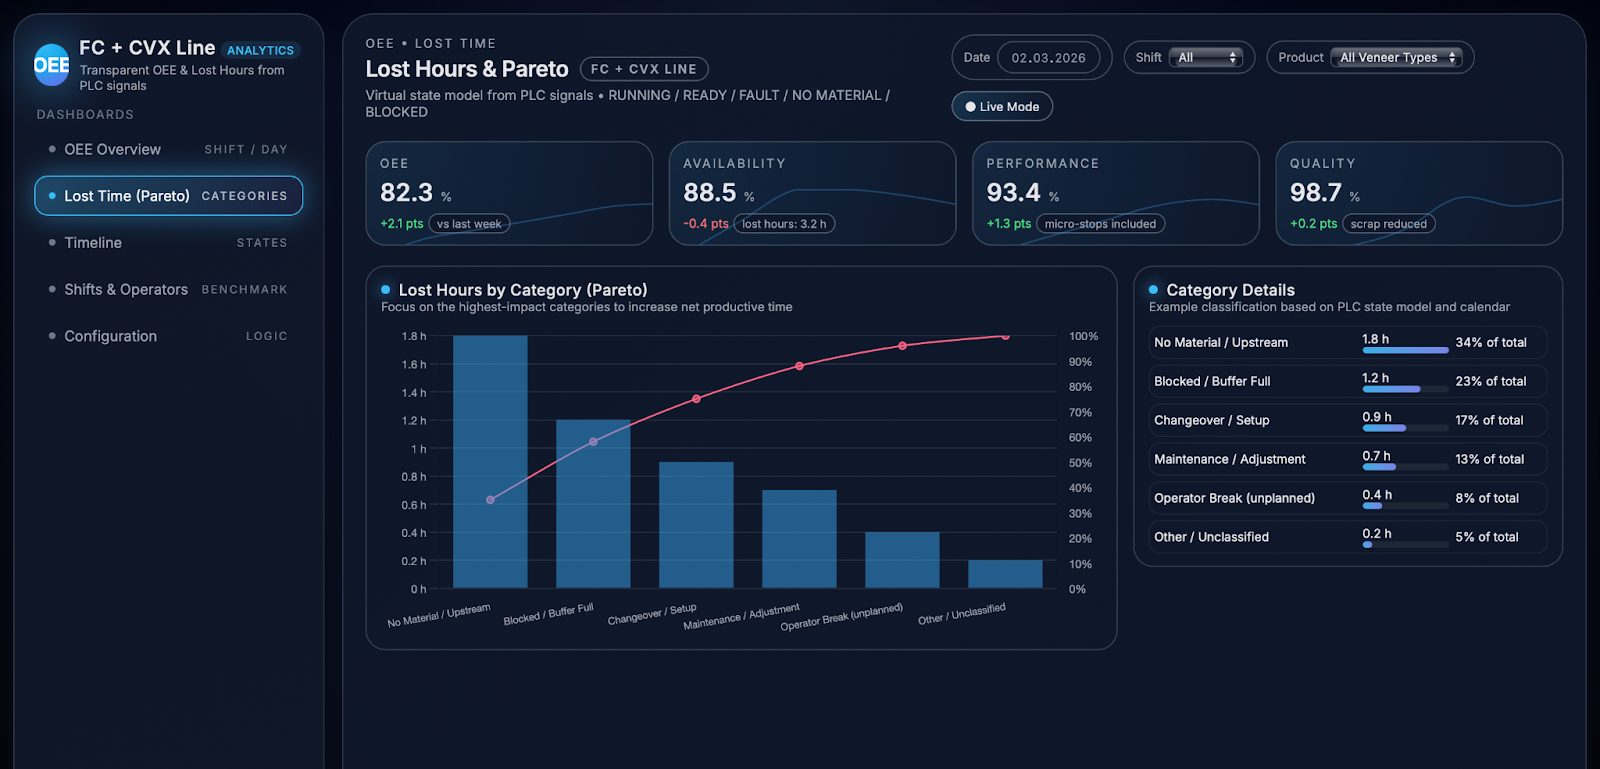
On the OEE overview dashboard, these calculations come together in a compact view that shows OEE, Availability, Performance, and Quality across days and shifts, alongside a breakdown of operating versus lost time. Users can immediately see how today compares to last week, which shifts are closest to the target line, and whether changes in OEE are driven more by availability, performance, or quality. A dedicated Lost Hours & Pareto view then sorts loss categories by impact, using bars and cumulative curves to highlight where most productive time is being lost and how each category contributes to the overall gap between actual and potential output. This combination of high‑level KPIs with detailed loss analytics enables teams to move from abstract discussions about “low OEE” to very concrete, data‑backed improvement actions focused on the categories that matter most.

Dashboards and Use Cases

The dashboards translate the underlying data model into views that are directly usable in daily operations and decision‑making on the FC + CVX line. A central element is the timeline view, which presents a full shift as a Gantt‑style sequence of colour‑coded machine states such as RUNNING, READY, FAULT, NO MATERIAL, and BLOCKED, making it easy to see when and where production actually flowed and where it stopped. Orders, changeovers, and selected operator actions can be overlaid on this timeline, so engineers and supervisors can visually correlate state changes with specific events, for example identifying that a long NO MATERIAL period consistently appears after certain orders, or that repeated BLOCKED intervals coincide with stack changes on the downstream equipment.

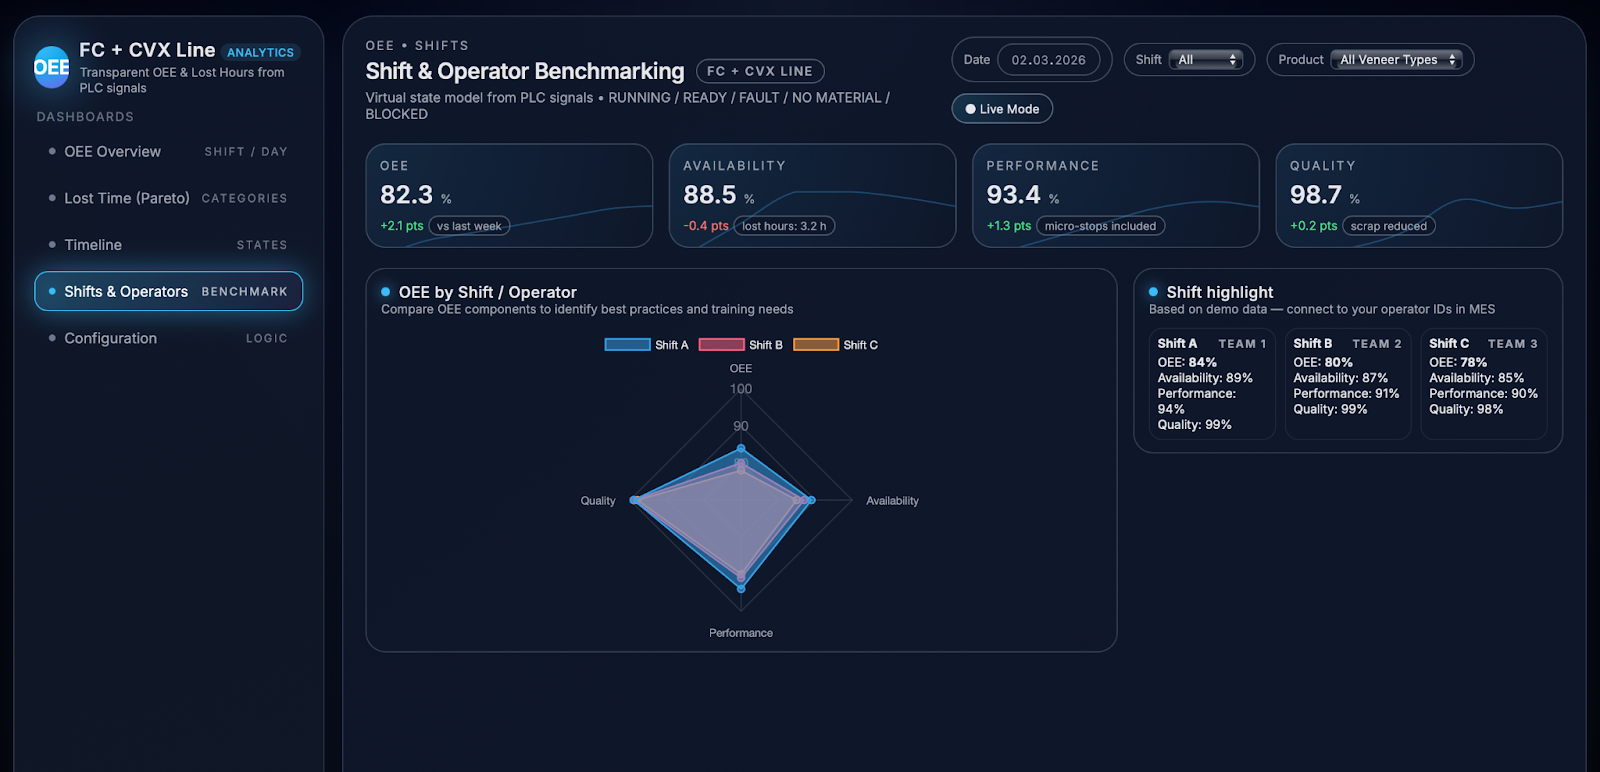
To understand differences in behaviour between teams, the solution includes a shift and operator benchmarking view that aggregates OEE components and lost‑hours categories for each shift or operator ID. Radar charts and compact comparison panels show, at a glance, which shifts achieve higher availability or fewer “No Material” and “Blocked” losses, and which ones spend more time in changeovers or unplanned breaks. This not only highlights best performers and practices that can be shared, but also reveals specific training needs, such as teams that require support in changeover standardisation or in reacting to early signals of buffer blocking. Because the same logic is applied consistently to all shifts and operators, discussions about performance become fact‑based rather than anecdotal.

The analytics can be delivered as a standalone application or integrated into the customer’s existing digital ecosystem. Interfaces to MES, ERP, and maintenance systems ensure that order information, calendars, and maintenance logs stay in sync, while OEE and lost‑hours KPIs can be exposed to tools such as Power BI or Grafana for broader reporting. Role‑based access makes it possible to tailor views for management, engineers, and operators, ensuring that each group sees the level of detail it needs without overloading the interface. This tight integration reduces manual reporting effort and makes the analytics part of the standard workflow rather than an extra step.

Business Value

From a business perspective, the dashboards turn OEE from a static KPI into a practical improvement tool. By showing exactly where time is lost and how this pattern changes over days and weeks, they help teams prioritise actions with the highest leverage, whether that is improving material logistics to reduce NO MATERIAL time, adjusting buffer and stack‑handling processes to cut BLOCKED losses, or standardising changeovers. Even relatively small gains in availability or performance translate directly into additional productive hours on the existing equipment, postponing or reducing the need for capital investments. At the same time, the quantified breakdown of losses provides a solid, data‑driven basis for justifying investments when they are needed, such as additional buffers, automation around stack handling, or extra staffing on specific shifts. Over time, this combination of transparency, feedback, and measurable impact supports a continuous improvement culture in which management, maintenance, and operators work from the same facts and can see the results of their decisions on the FC + CVX line.

Conclusions and Next Steps

The implementation of full OEE and lost‑hours analytics on the FC + CVX line has turned raw machine data into a shared, operational picture of how the line actually runs over time. The team now has transparent visibility of when the line is RUNNING, READY, starved of material, blocked by downstream equipment, or stopped due to faults, maintenance, or operator‑related reasons, all quantified down to seconds within planned production time. Instead of debating why OEE is low in general, managers, engineers, and operators can see a factual breakdown of losses by category, shift, product, and module, which has already enabled targeted actions such as reducing “No Material” time, smoothing stack changes, and tightening changeover procedures. As a result, the FC + CVX line has gained measurable improvements in net productive time and stability without any additional investment in hardware, while also reducing manual reporting effort and ambiguity in performance discussions.

The next step is to treat this use case as a template for the wider production network. Because the approach relies mainly on existing PLC and MES/ERP data, the same virtual state model and OEE logic can be adapted to other lines and plants with similar architecture, gradually building a consistent analytics layer across the factory. Additional use cases can be added on top of the same data foundation, for example deeper maintenance analytics based on recurring fault patterns, energy‑per‑throughput monitoring, or early‑warning alerts for rising loss categories. Over time, the rule‑based classification of lost hours can be enhanced with machine‑learning components that automatically refine thresholds, detect new patterns in downtime, and suggest the most likely root causes for unexplained losses. This roadmap turns the FC + CVX line from a single successful project into a scalable analytics platform that supports continuous improvement and data‑driven decision‑making across the entire production system.

Build Product
Build Strategy
Web Development

Our success stories

Predictive maintenance for heating & glue system

Predictive maintenance solution for the Heating & Glue system on the FC + CVX production line.
AI/ML
IoT
Web Development

Full OEE and Lost‑Hours Analytics for the FC + CVX Line

Digital OEE and lost-hours analytics solution for the FC + CVX high-throughput veneer production line.
AI/ML
IoT
Web Development

Automatic stop detection & classification: Micro-stop Analytics

Advanced micro-stop analytics with ML-assisted classification and root-cause insights
AI/ML
IoT
Web Development
CRM/ERP

Automatic stop detection & classification: Microstop

Micro-stop Monitor detects and classifies short production stops using PLC data and rules
AI/ML
IoT
Web Development

AI Regulatory & Licensing Compliance Copilot

AI copilot for regulatory and licensing compliance across multiple jurisdictions
AI/ML
CRM/ERP
Web Development

AI Due Diligence Platform for M&A and New Projects

AI platform for automated M&A and new project due diligence
AI/ML
CRM/ERP
Web Development

Autonomous Dispatch & BESS AI Optimization

AI engine for portfolio dispatch and BESS optimization across volatile energy markets
AI/ML
IoT
Web Development

AI Asset Health & Degradation Prediction System

AI system for asset health monitoring and degradation prediction
AI/ML
IoT
Web Development

AI CO ₂ Calculator & ESG Impact Platform

AI-powered platform for automated CO₂ accounting and ESG reporting
AI/ML
Web Development

Oll.tv: From Vision to Reality — Crafting Ukraine’s Leading Streaming Platform

Oll.tv launched as Ukraine’s leading IPTV/VOD platform with 200K+ users and a seamless multi-platform experience
Mobile Development
Web Development

Cyber BMS: Rethinking Infrastructure Management for the Digital Age

Cyber BMS upgraded its system with modular design, automation, and real-time dashboards
CRM/ERP
Mobile Development
Web Development

Transforming Logistics Operations with Infinity Technologies

Infinity Technologies redesigned a logistics operator system, automating workflows and enabling mobile operations across all branches.
CRM/ERP
Mobile Development
Web Development

Infinity Technologies in Logistics

Infinity Technologies built a smarter logistics platform with better UX and full digital integration.
CRM/ERP
Mobile Development
Web Development

Cross-recipe: Energy vs Quality Analysis

A data-driven system optimized veneer press energy usage while maintaining product quality.
AI/ML
IoT
Feedforward Press Correction

Feedforward Press Correction

A leading engineered wood manufacturer implemented a predictive press control system powered by data and machine learning.
AI/ML
IoT
Web Development
“Bad-Sheet” Routing

“Bad-Sheet” Routing

Automated system for detecting and routing defective veneer sheets using real-time sensor data and analytics.
AI/ML
IoT

Early Fan Failure Detection

Plant A deployed an on-prem predictive maintenance system for fans, reducing unplanned downtime by 38%.
AI/ML
Predictive Hydraulic Filter Change

Predictive Hydraulic Filter Change

Predictive maintenance system for hydraulic filters reduced downtime and optimized maintenance scheduling in a large industrial plant.
IoT
AI/ML

Infinity Technologies in PetTech

A smart genetic testing platform that helps pet owners and breeders easily access and understand their pets’ DNA insights through a single digital solution.
AI/ML
IoT
Mobile Development

Infinity Technologies in Healthcare

How Infinity Technologies is transforming healthcare with digital platforms that enhance patient engagement, streamline operations, and boost business performance.
Mobile Development
Web Development
CRM/ERP

Intelligent Budgeting: How AI-Powered Financial Planning Transforms Business Strategy

A case study on how intelligent budgeting transformed financial planning, decision-making, and organizational agility.
AI/ML
CRM/ERP
Smarter Product Management Through Interactive Constructors and Real-Time Analytics

Smarter Product Management Through Interactive Constructors and Real-Time Analytics

An interactive, analytics-powered product constructor enabled smarter pricing, faster product decisions, and improved profitability across a complex portfolio.
AI/ML
CRM/ERP
The Power of Precision: How One Company Achieved 99.1% Sales Forecast Accuracy

The Power of Precision: How One Company Achieved 99.1% Sales Forecast Accuracy

A large-scale sales forecasting system achieved 99.1% accuracy across hundreds of products using data-driven, automated models.
AI/ML
CRM/ERP
Smarter Energy Forecasting in Manufacturing

Smarter Energy Forecasting in Manufacturing: Turning Data Into Cost Savings

A real-world case study on how predictive energy forecasting helps manufacturers cut costs and improve efficiency.
IoT
AI/ML
CRM/ERP
Smarter Hatching: How Predictive Modeling Transforms Poultry Incubation

Smarter Hatching: How Predictive Modeling Transforms Poultry Incubation

A poultry farm used AI and real-time data to optimize incubation, improving chick quality and operational efficiency.
AI/ML
IoT
Web Development
Predictive Analytics in Healthcare: The Future of Cardiovascular Risk Detection

Predictive Analytics in Healthcare: The Future of Cardiovascular Risk Detection

Predictive analytics model for early cardiovascular risk detection using non-invasive population data.
AI/ML
CRM/ERP
Smart Fraud Detection: How Predictive Analytics is Reshaping Social Welfare Systems

Smart Fraud Detection: How Predictive Analytics is Reshaping Social Welfare Systems

A public agency used predictive analytics to overhaul fraud detection in social welfare distribution.
AI/ML
Risk-Based Oversight of Social Benefits: Catching Fraud Without Hiring More Staff

Risk-Based Oversight of Social Benefits: Catching Fraud Without Hiring More Staff

Case study: shifting from random checks to risk-based fraud detection in social benefits.
AI/ML
Predicting Employee Turnover: How Data Turns Retention into a Strategy

Predicting Employee Turnover: How Data Turns Retention into a Strategy

This article explores how predictive analytics is transforming employee retention from a reactive process into a strategic advantage.
AI/ML
IoT
CRM/ERP
How Predicting Customer Churn Helps Banks Grow: A Case Study with 1500% ROI

How Predicting Customer Churn Helps Banks Grow: A Case Study with 1500% ROI

A real-world case study showing how predictive analytics helped a bank cut churn by 71% and achieve 1500% ROI through targeted retention.
AI/ML
CRM/ERP
Smarter Compliance: How Automated Risk Assessment Transforms Contractor Fraud Detection in Banking

Smarter Compliance: How Automated Risk Assessment Transforms Contractor Fraud Detection in Banking

This article explores how automated risk classification enhanced fraud detection and compliance efficiency in banking.
AI/ML
Smarter Loan Campaigns with Predictive Models

Smarter Loan Campaigns with Predictive Models

How predictive analytics helps banks improve cross-selling by reducing risk, cutting waste, and targeting the right customers.
CRM/ERP
AI/ML
Predictive Modeling Cuts Marketing Costs by 93% in Banking Campaign

Predictive Modeling Cuts Marketing Costs by 93% in Banking Campaign

A bank applied predictive modeling to identify high-response customers, reducing campaign costs from full budget to just 7% while maintaining results.
AI/ML
Risk-Based Personalization Boosts SME Overdraft Lending

Risk-Based Personalization Boosts SME Overdraft Lending

A major European bank revamped its SME overdraft lending by introducing a data-driven model that adjusted loan limits based on individual risk profiles, boosting both portfolio size and profit.
AI/ML
CRM/ERP
From 4 Months to 30 Minutes: The New Speed of Credit Scoring
August 2025

From 4 Months to 30 Minutes: The New Speed of Credit Scoring

A bank cut credit model time from four months to 30 minutes by automating risk assessment for corporate clients.
AI/ML

Designing a Decentralized Social Platform for the Web3 Era

Infinity Technologies builds a blockchain-based social network where users own their data, control their content, and earn from engagement
Blockchain
Web Development

Tokenizing Music: A Marketplace for NFT-Based Ownership and Royalties

Infinity Technologies builds a blockchain platform where artists can mint music NFTs representing ownership, licensing rights, and revenue shares
Blockchain
Web Development

Building a Blockchain Game That Pays to Play

Infinity Technologies delivers a play-to-earn gaming platform where users collect, trade, and monetize digital assets on-chain
Blockchain
Web Development

Engineering DeFi and CeFi Wallets for the Modern Crypto Economy

Infinity Technologies delivers two complementary wallet platforms — a DeFi aggregator and a CeFi digital finance hub — to meet the evolving needs of crypto users
Blockchain
Web Development

Building a Full-Scale Centralized Crypto Exchange Platform

Infinity Technologies engineers a secure, feature-rich trading ecosystem supporting spot, margin, futures, and copy trading — built for performance and scalability
Blockchain
Web Development

Powering Real Estate Growth Through Role-Based CRM Automation

Infinity Technologies delivers a modern CRM system tailored to brokers, agents, clients, and admins — boosting lead conversion, transparency, and operational efficiency
CRM/ERP
Web Development

Engineering a Smart Mobility Ecosystem for On-Demand Ride Services

Infinity Technologies designs and builds a modular taxi platform integrating driver, passenger, and admin experiences into a single high-performance solution
Web Development

Human Cloud: A Smarter Way to Connect Developers with Projects

Infinity Technologies launches a private talent-matching platform to speed up hiring, improve collaboration, and protect privacy
Web Development
CRM/ERP

10,000+ Employees, One System: Transforming a National Logistics Giant with a Unified ERP

Infinity Technologies leads a five-year transformation to digitize HR, operations, document management, and forecasting for a major delivery company
CRM/ERP
Web Development
Mobile Development

Delivering Smarter: Automating the Last Mile for a Leading Ukrainian 3PL Operator

Infinity Technologies builds a cloud-native order management platform, increasing processing speed by 85% and accuracy by 97%
Web Development
CRM/ERP
Accelerating International Cargo Delivery with Automation

Accelerating International Cargo Delivery with Automation

Infinity Technologies builds a lightweight, scalable last-mile platform for a leading Ukrainian 3PL provider
Web Development
CRM/ERP
Hazard materials

Saudi Arabia’s National Platform for Hazardous Materials Oversight

Infinity Technologies leads the design of a unified digital platform for the secure tracking, regulation, and compliance of hazardous material logistics
Web Development
Modernizing Meest Express: A Digital Leap in Customer Experience for Global Logistics

Modernizing Meest Express: A Digital Leap in Customer Experience for Global Logistics

Infinity Technologies transforms user engagement, order visibility, and ERP automation for a leading international delivery provider
Web Development
CRM/ERP
Human Cloud: Reimagining Developer Recruitment Through Smart Matching

Human Cloud: Reimagining Developer Recruitment Through Smart Matching

Infinity Technologies builds a platform that transforms how companies and developers connect — with anonymity, precision, and speed
Web Development
CRM/ERP
Smarter Fields, Smarter Yields: Building a Telemetry Platform for Farm Machinery at Any Scale

Smarter Fields, Smarter Yields: Building a Telemetry Platform for Farm Machinery at Any Scale

Infinity Technologies delivers a cross-platform IoT solution that gives farmers real-time visibility and control over diverse agricultural fleets
IoT
CRM/ERP
Web Development
FM Logistic: Transforming Last-Mile Delivery Through Scalable Automation

FM Logistic: Transforming Last-Mile Delivery Through Scalable Automation

Infinity Technologies builds a robust warehouse and order management platform to power 3PL logistics across Ukraine
CRM/ERP
Web Development
Harnessing the Sun Smarter: Building a Scalable IoT Platform for Solar System Monitoring

Harnessing the Sun Smarter: Building a Scalable IoT Platform for Solar System Monitoring

Infinity Technologies delivers an intelligent energy monitoring solution that increases solar system efficiency by up to 60%
IoT
Web Development
Mobile Development
Going Global with Shopify: Building a Scalable eCommerce Ecosystem

Going Global with Shopify: Building a Scalable eCommerce Ecosystem

Infinity Technologies delivers a custom Shopify website and cross-platform mobile app, boosting sales by 163%
CRM/ERP
Web Development
Mobile Development
Scaling a Global Flowers & Gifts Platform Across 9 Countries

Scaling a Global Flowers & Gifts Platform Across 9 Countries

Infinity Technologies builds a high-performance, microservices-based e-commerce system with AI-powered personalization and CRM automation
Web Development
Enabling Digital Labor Governance in Saudi Arabia

Enabling Digital Labor Governance in Saudi Arabia

Infinity Technologies designs a high-load e-government platform for processing over 1 million workforce requests per day
Web Development
CRM/ERP
Empowering Swiss Citizens to Control Their Pension Assets

Empowering Swiss Citizens to Control Their Pension Assets

Infinity Technologies builds a national FinTech platform for pension data transparency and collective action
Web Development
Mobile Development
Transforming Swiss Healthcare: Building the Nation’s Leading Medical Appointment Booking Platform

Transforming Swiss Healthcare: Building the Nation’s Leading Medical Appointment Booking Platform

Infinity Technologies develops and scales a connected ecosystem for over 21,000 healthcare providers across Switzerland
Mobile Development
Web Development
How Infinity Technologies Built Two E-Commerce Platforms from One Codebase

How Infinity Technologies Built Two E-Commerce Platforms from One Codebase

Helping a food service group grow during crisis through rapid digital transformation
CRM/ERP
Web Development
Mobile Development
Nova Poshta: AI-Powered Warehouse Monitoring for Conveyor Systems

Nova Poshta: AI-Powered Warehouse Monitoring for Conveyor Systems

Infinity Technologies Builds Real-Time Load Balancing and Bottleneck Detection for Ukraine’s Largest Logistics Operator
AI/ML
CRM/ERP
IoT
Web Development
VodafoneTV: Building a Global-Scale Video Content Management Ecosystem

VodafoneTV: Building a Global-Scale Video Content Management Ecosystem

Infinity Technologies Develops End-to-End IPTV, OTT, and DVB Solution for Vodafone Group
Web Development
Mobile Development
Zimit CPQ: Enterprise Quote Analytics for a Global Technology Leader

Zimit CPQ: Enterprise Quote Analytics for a Global Technology Leader

Infinity Technologies Customizes and Scales a Complex Quoting Engine for Industrial Automation and Infrastructure Sales Teams
Web Development
CRM/ERP
Fitto: IoT Ecosystem That Powers Smart Supplement Consumption

Fitto: IoT Ecosystem That Powers Smart Supplement Consumption

Infinity Technologies Builds a Personalized Health-Tech Platform Combining Smart Hardware, AI, and Cloud
IoT
Mobile Development
Web Development
EdTech Platform That Reinvents Peer Tutoring for Swiss Schools

EdTech Platform That Reinvents Peer Tutoring for Swiss Schools

Disrupt the traditional tutoring industry.
Mobile Development
Web Development
Custom EDMS with Agile Workflows for a National Logistics Operator

Custom EDMS with Agile Workflows for a National Logistics Operator

Infinity Technologies Builds an Intelligent Document Management Platform that Drives Efficiency and Reduces Costs
Web Development
Interactive Product Portfolio for BASF

Interactive Product Portfolio for BASF

‍Infinity Technologies Builds a Scalable Web Platform for Cross-Continental Presale Collaboration
Web Development
SOSbooking: Local Service Marketplace Empowering Swiss Communities

SOSbooking: Local Service Marketplace Empowering Swiss Communities

Infinity Technologies Builds a Scalable Two-Sided Platform for On-Demand Task Fulfillment
Web Development
Mobile Development