


The table of content
Introduction
Stable glue application and correct temperature control are important for keeping product quality consistent on the production line and for avoiding defects or unexpected stops. The heating and glue system includes several controlled zones and circuits that keep temperature, pressure, and flow within the required range during production. When the system works as expected, the process runs smoothly and the quality stays stable. If temperature moves away from the setpoint, pressure becomes unstable, or heating elements start to wear out, the result can be poor bonding, material defects, scrap, or short stops that may later turn into longer downtime. In many cases, these problems are noticed only after defects appear in the final product or when a failure forces an urgent repair, so the team has to react without clearly knowing what caused the issue.
The goal of this predictive maintenance use case is to move from reacting to problems to preventing them. The solution continuously monitors the condition of the heating and glue system using data that is already available from the production line. Instead of waiting for alarms or quality complaints, it tracks temperature behaviour, pressure stability, alarm signals, and operating conditions such as product type, speed, and shift. This makes it possible to detect early signs of drift, wear, or unstable behaviour in individual zones or circuits.
Based on this information, the system can warn when parameters start to move out of the normal range and suggest actions such as inspection, adjustment, cleaning, or part replacement during planned maintenance time.
For engineers, this gives a clear view of what is not working as expected.
For maintenance, it helps plan work before a failure happens.
For operators, it provides simple real-time feedback that makes it easier to react early and keep the process stable.
Data and Health Indicators
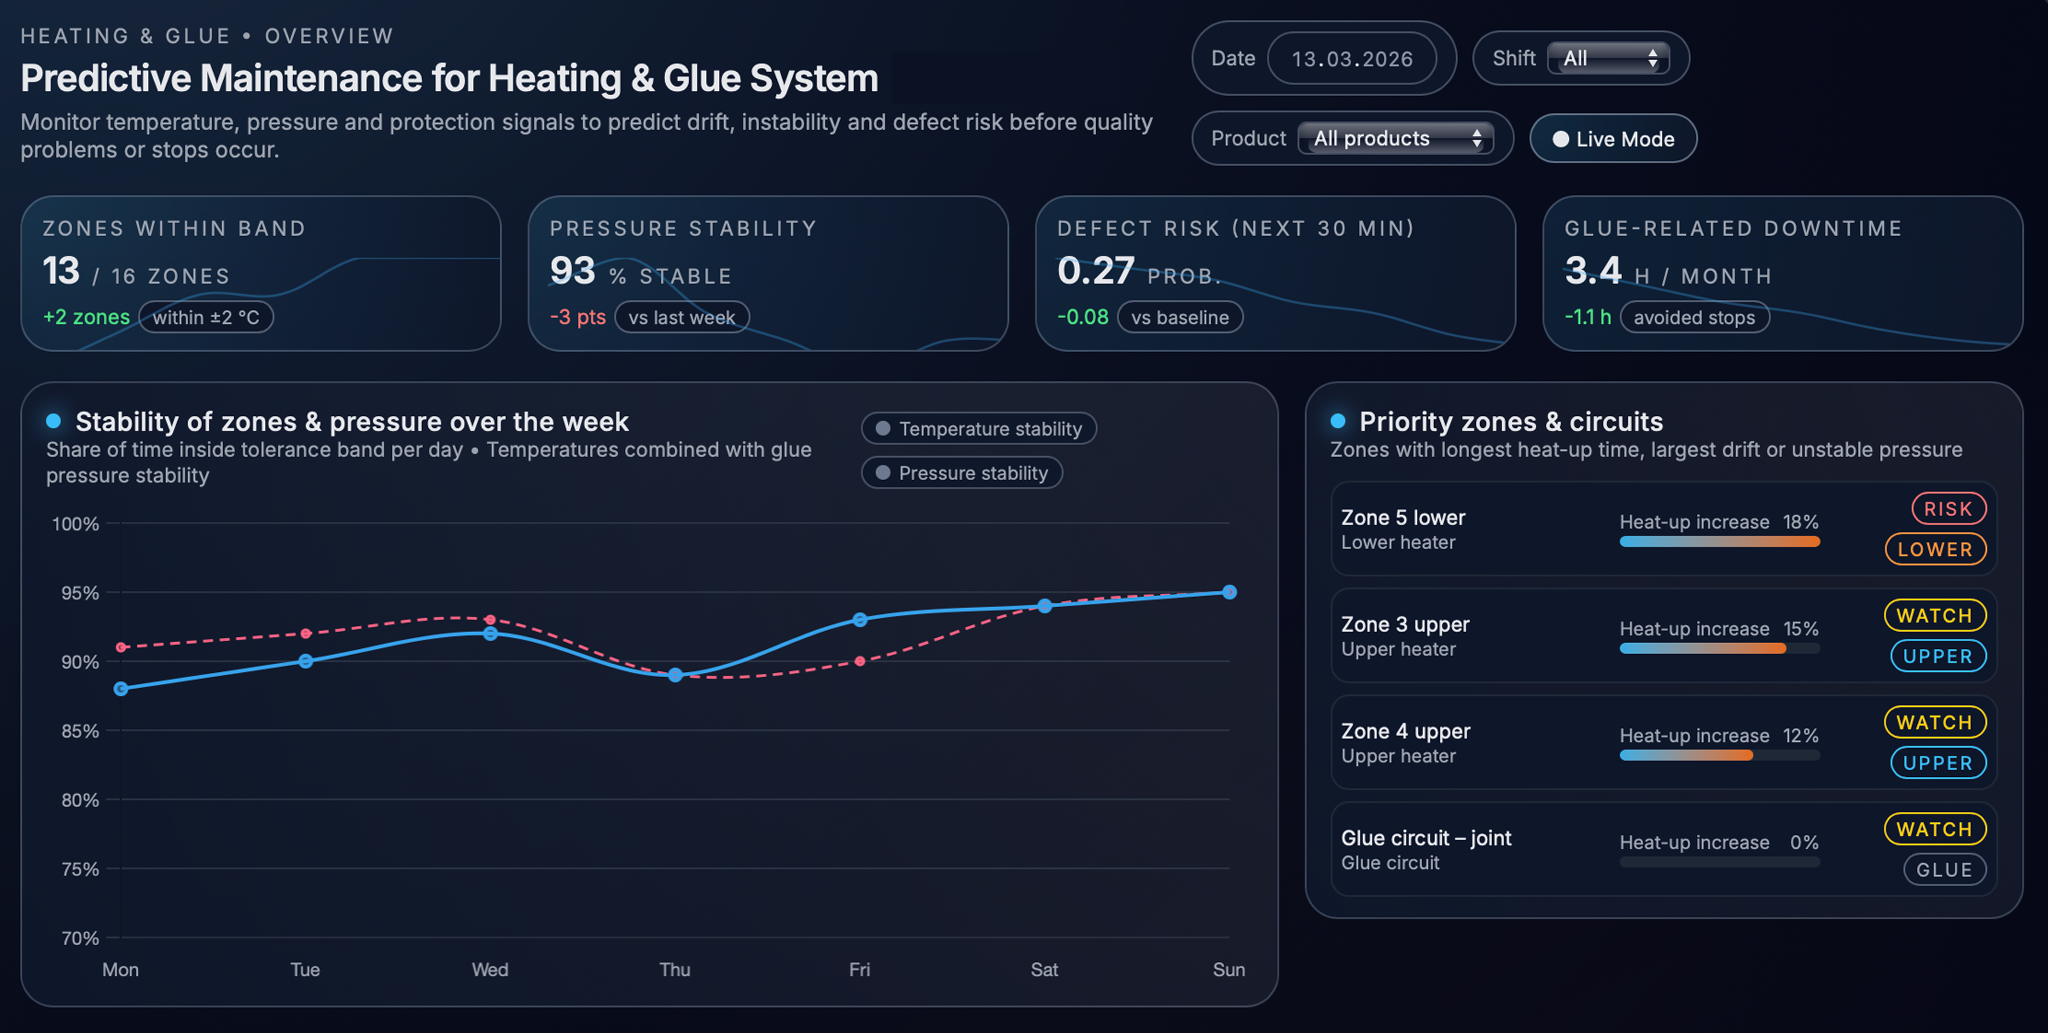
The predictive maintenance solution uses data that the heating and glue system already generates on the production line. The control system provides measurements such as temperatures in different heating zones, glue pressure, and alarm signals related to overheating, safety protection, or equipment faults. Additional context data describes the current production conditions, for example product type, recipe, line speed, shift, and operating mode. Quality records and maintenance logs are also included, so that process behaviour can be compared with real results and past service actions. Together, this information creates a continuous data history that shows both the condition of the system and the conditions in which it was running.
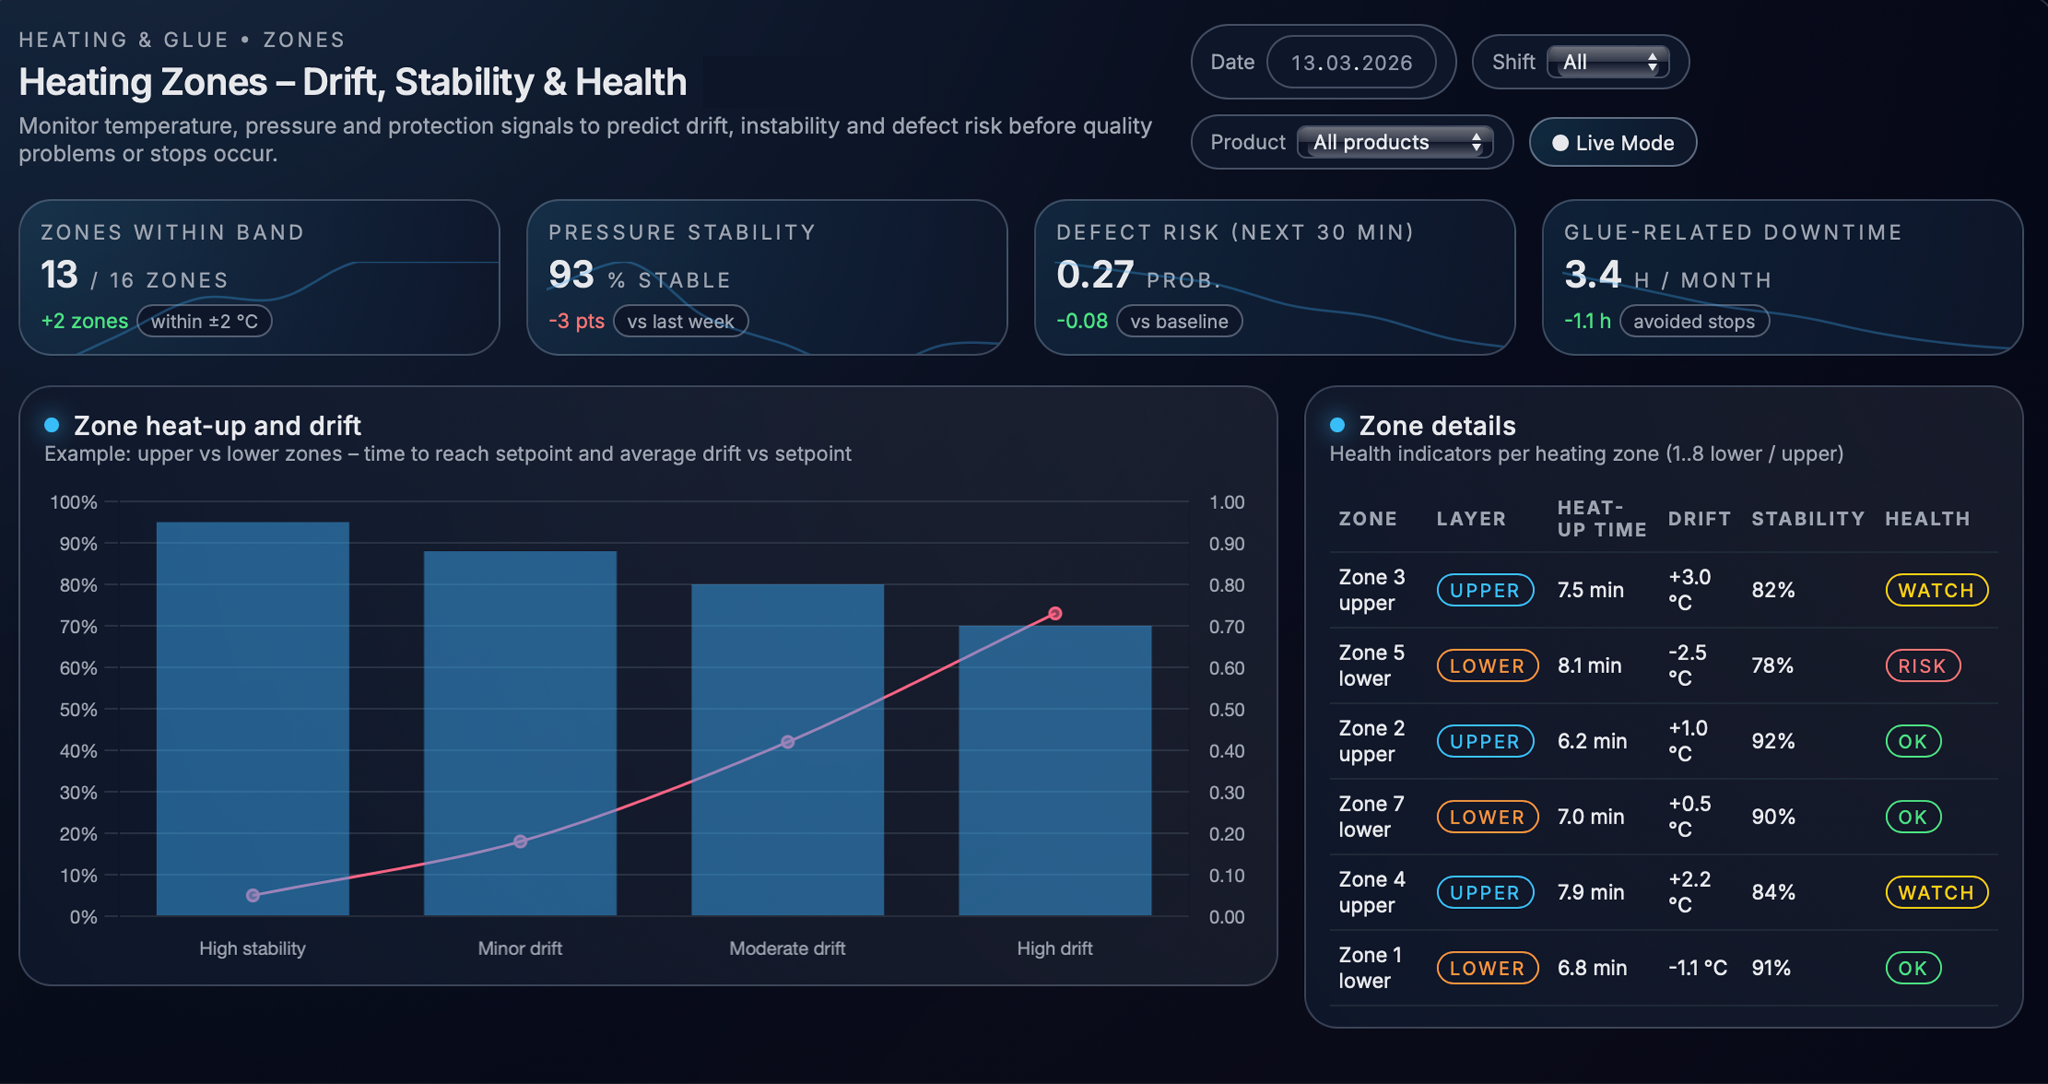
Based on this data, the system calculates simple health indicators that show how each heating zone and glue circuit behaves compared to its normal profile. It measures how long zones need to reach the target temperature, how stable the temperature stays during operation, and how much it deviates from the setpoint. Zones that heat up more slowly, drift from the target, or show unstable behaviour can be detected early. For the glue system, the solution monitors pressure level, short-term fluctuations, and unexpected drops or spikes that may affect process stability. These values are combined into clear status indicators, for example OK, Watch, or Risk, so that the condition of each zone or circuit can be understood without analyzing raw signals.
All indicators are stored over time and can be reviewed per shift, day, or longer period. Trend views make it possible to see slow changes that are not visible during normal operation, such as heating zones taking longer to reach temperature or pressure becoming less stable over several weeks. This helps engineers and maintenance teams decide what should be checked during the next planned stop, instead of waiting for defects or failures to appear. By detecting problems early, the system makes it possible to keep the process stable and reduce the risk of unplanned downtime while the production line continues running.
Forecasting, Drift Detection and Defect Risk
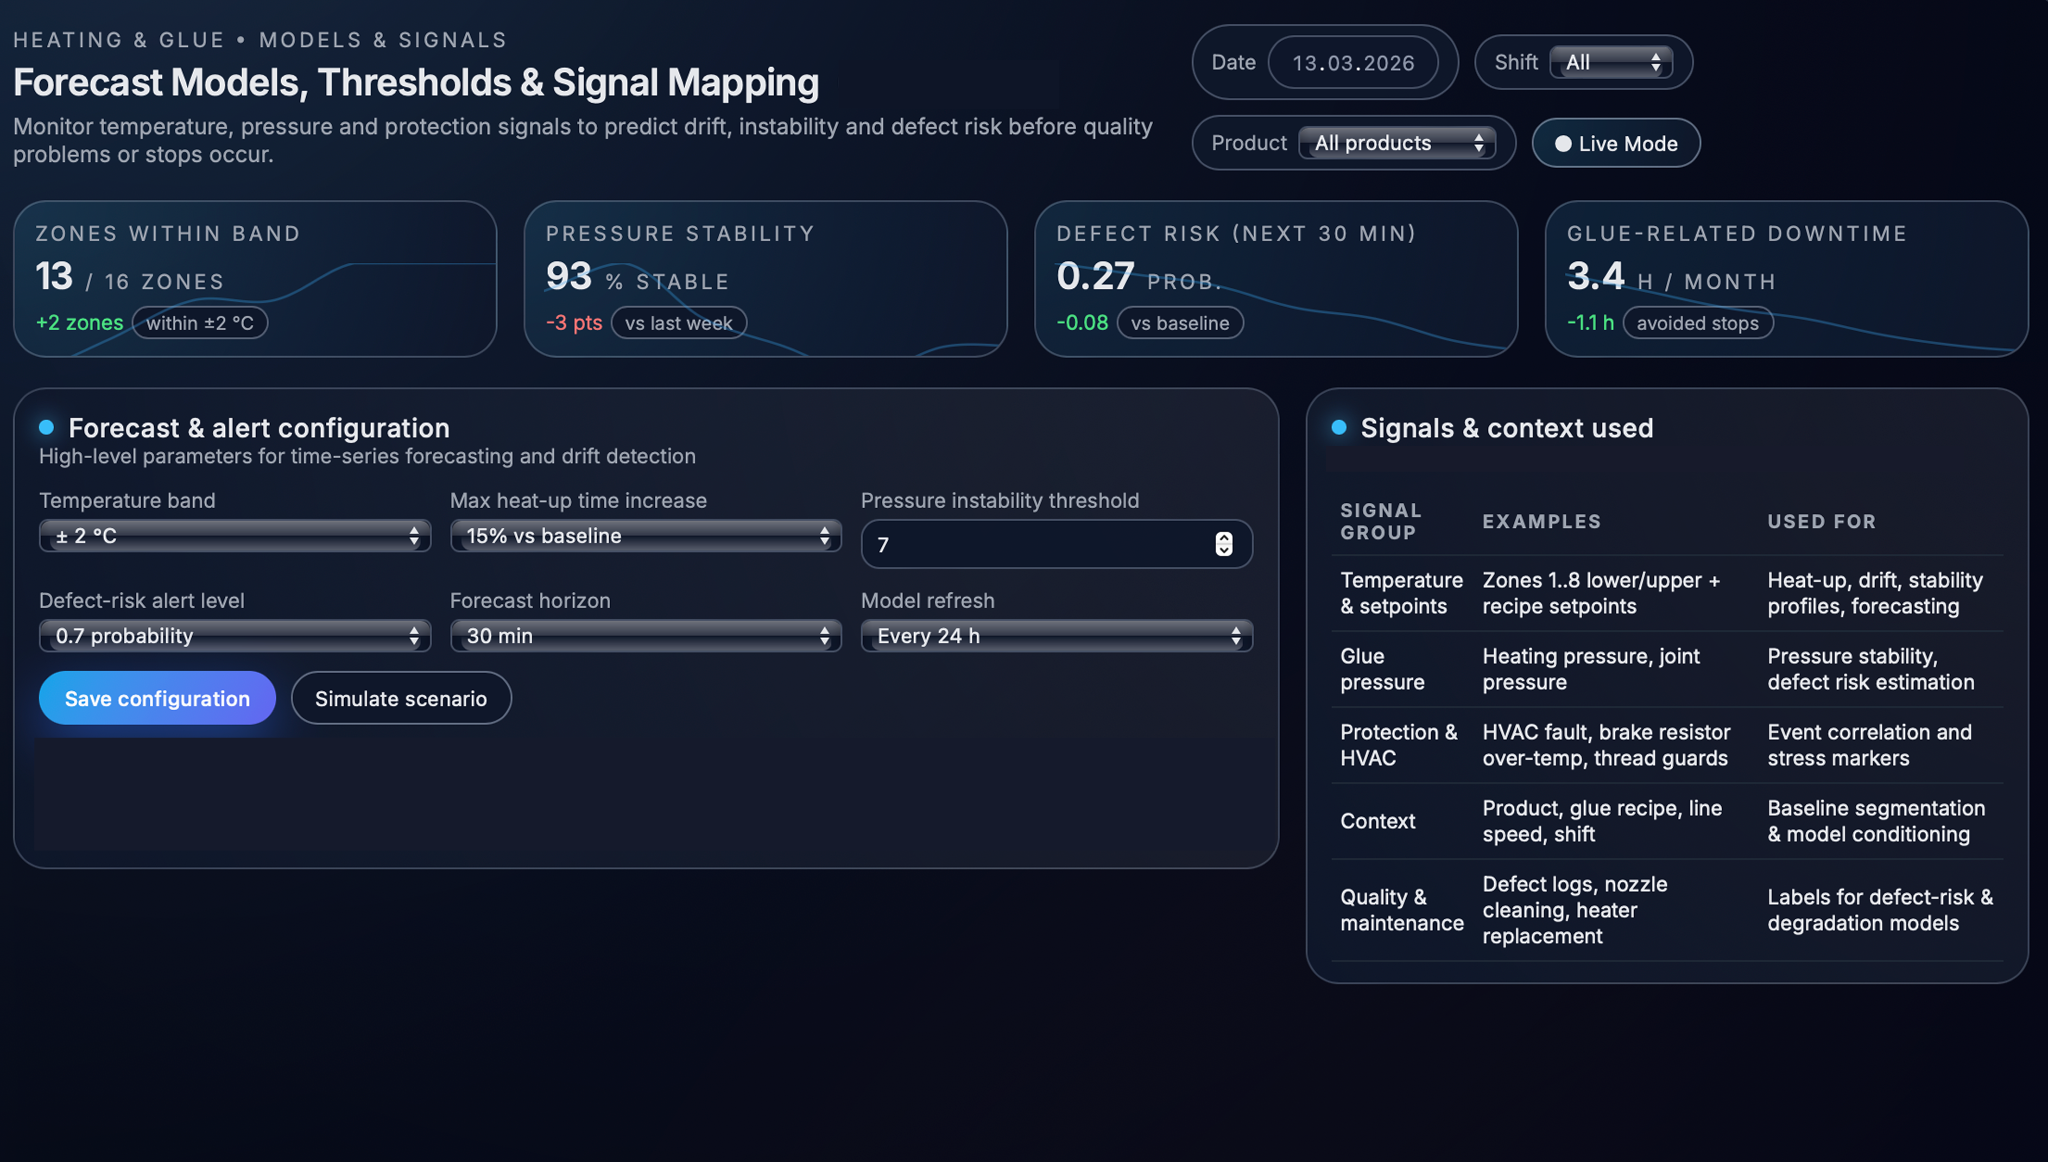
The solution not only shows the current condition of the heating and glue system, but also predicts how it will behave when production conditions change. Using historical data, the system learns how temperatures, pressure, alarms, speed, and operating modes normally change during start-up, stable production, changeovers, and slowdowns. When a new product, speed, or operating mode is planned, the system can estimate how the process will react and whether the heating zones and glue pressure will remain within the allowed range. If the prediction shows that the system may become unstable or respond too slowly, engineers can adjust settings in advance, for example by changing preheating time, speed, or process parameters.
To detect problems early, the system continuously compares the current behaviour with the normal behaviour learned from past data. Each heating zone and glue circuit has its own normal range, and when the real values move outside this range for a longer time, the system marks it as a possible drift. Such drift may mean that a heater is wearing out, a sensor needs calibration, or the process conditions have changed. Because all signals are analysed together, the system can also detect situations where several parameters influence each other, for example when one zone overheats while another stays too cold, or when pressure drops appear together with protection or safety events. This makes it easier to understand the real cause of the problem and decide what should be checked first.
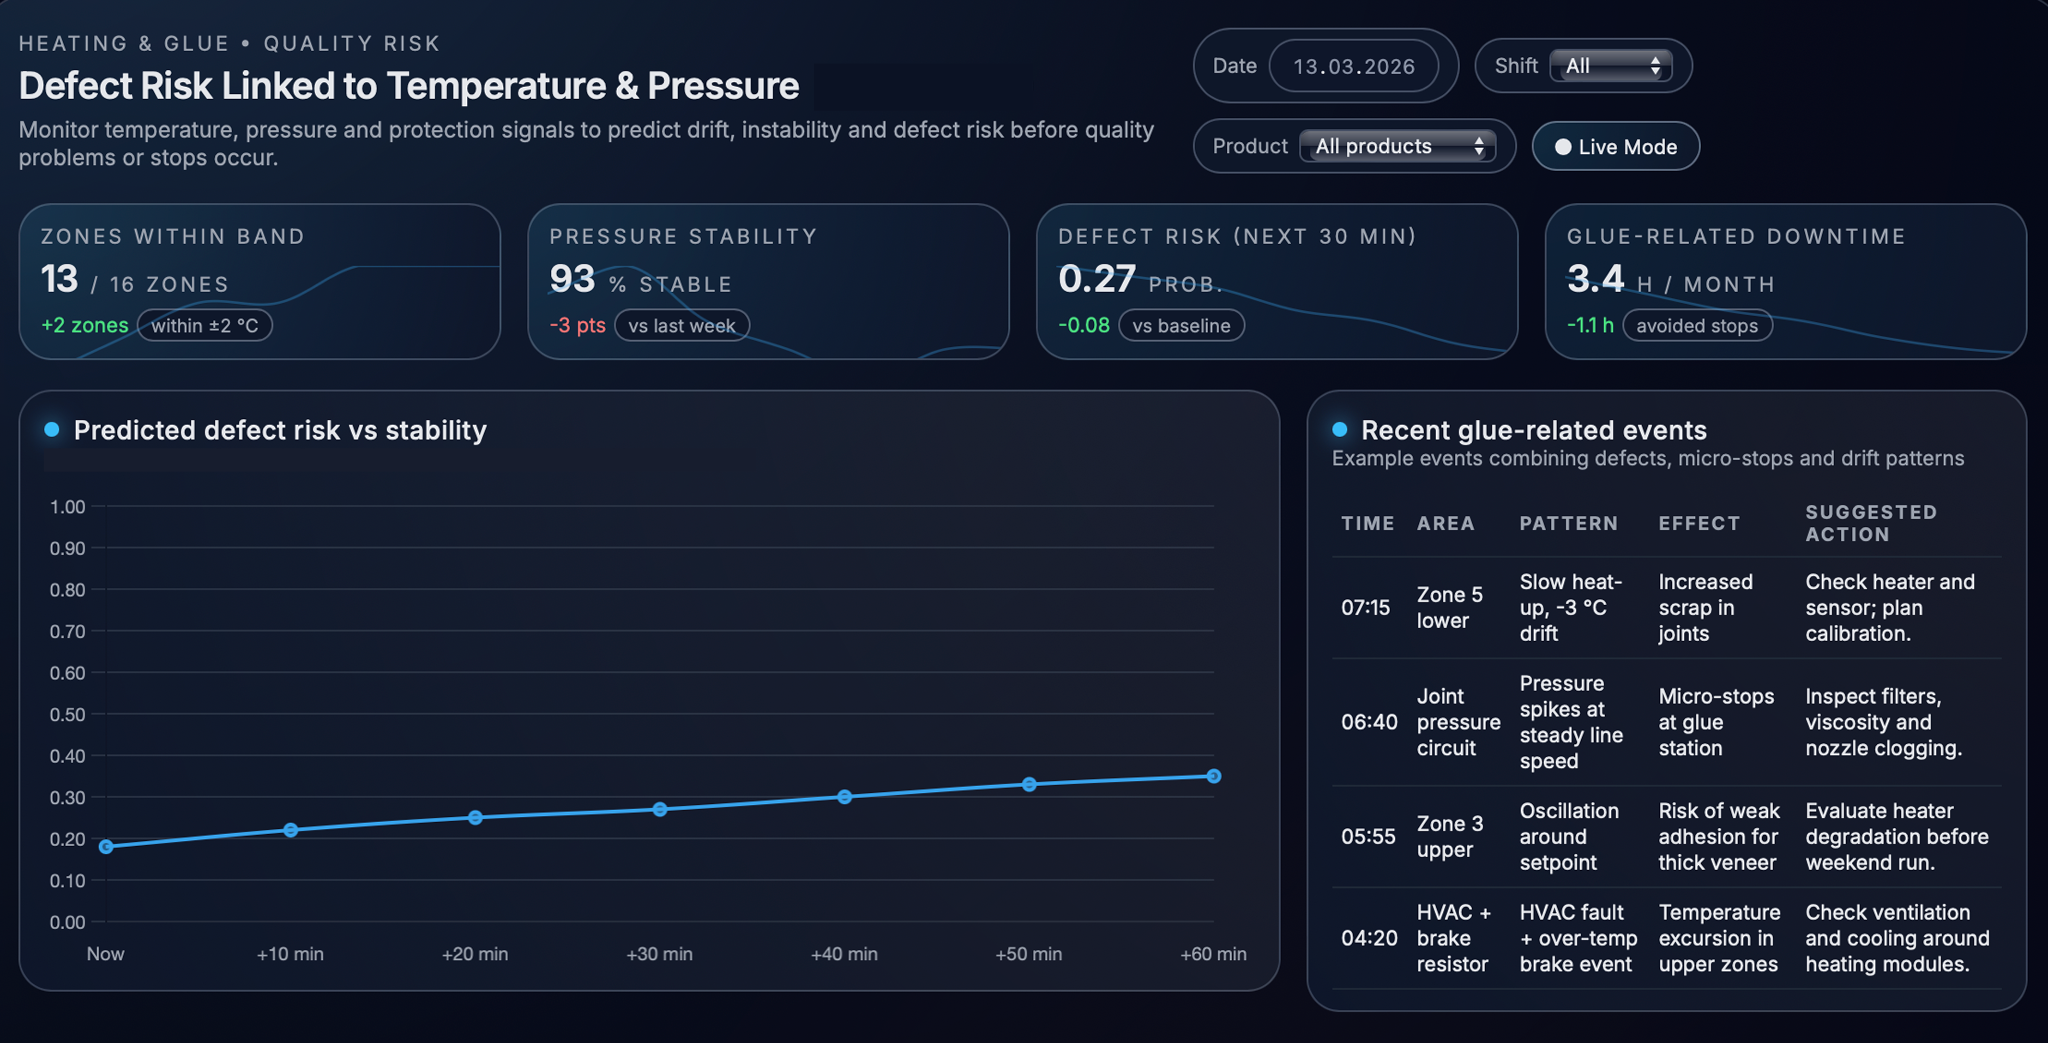
The most useful result is defect-risk estimation. By combining current measurements, trends, and past quality results, the system can estimate the risk of defects or short stops in the near future, for example during the next production run or shift. If similar signal patterns in the past caused quality problems or downtime, the system can warn the team in advance and show which zone or circuit may require attention.
These warnings help operators, engineers, and maintenance teams take action early, during planned stops if possible, instead of reacting after defects appear or the line stops. In this way, predictive maintenance becomes part of daily operation and helps keep the production line stable while reducing scrap and unexpected downtime.
Dashboards, Alerts and Operational Workflows
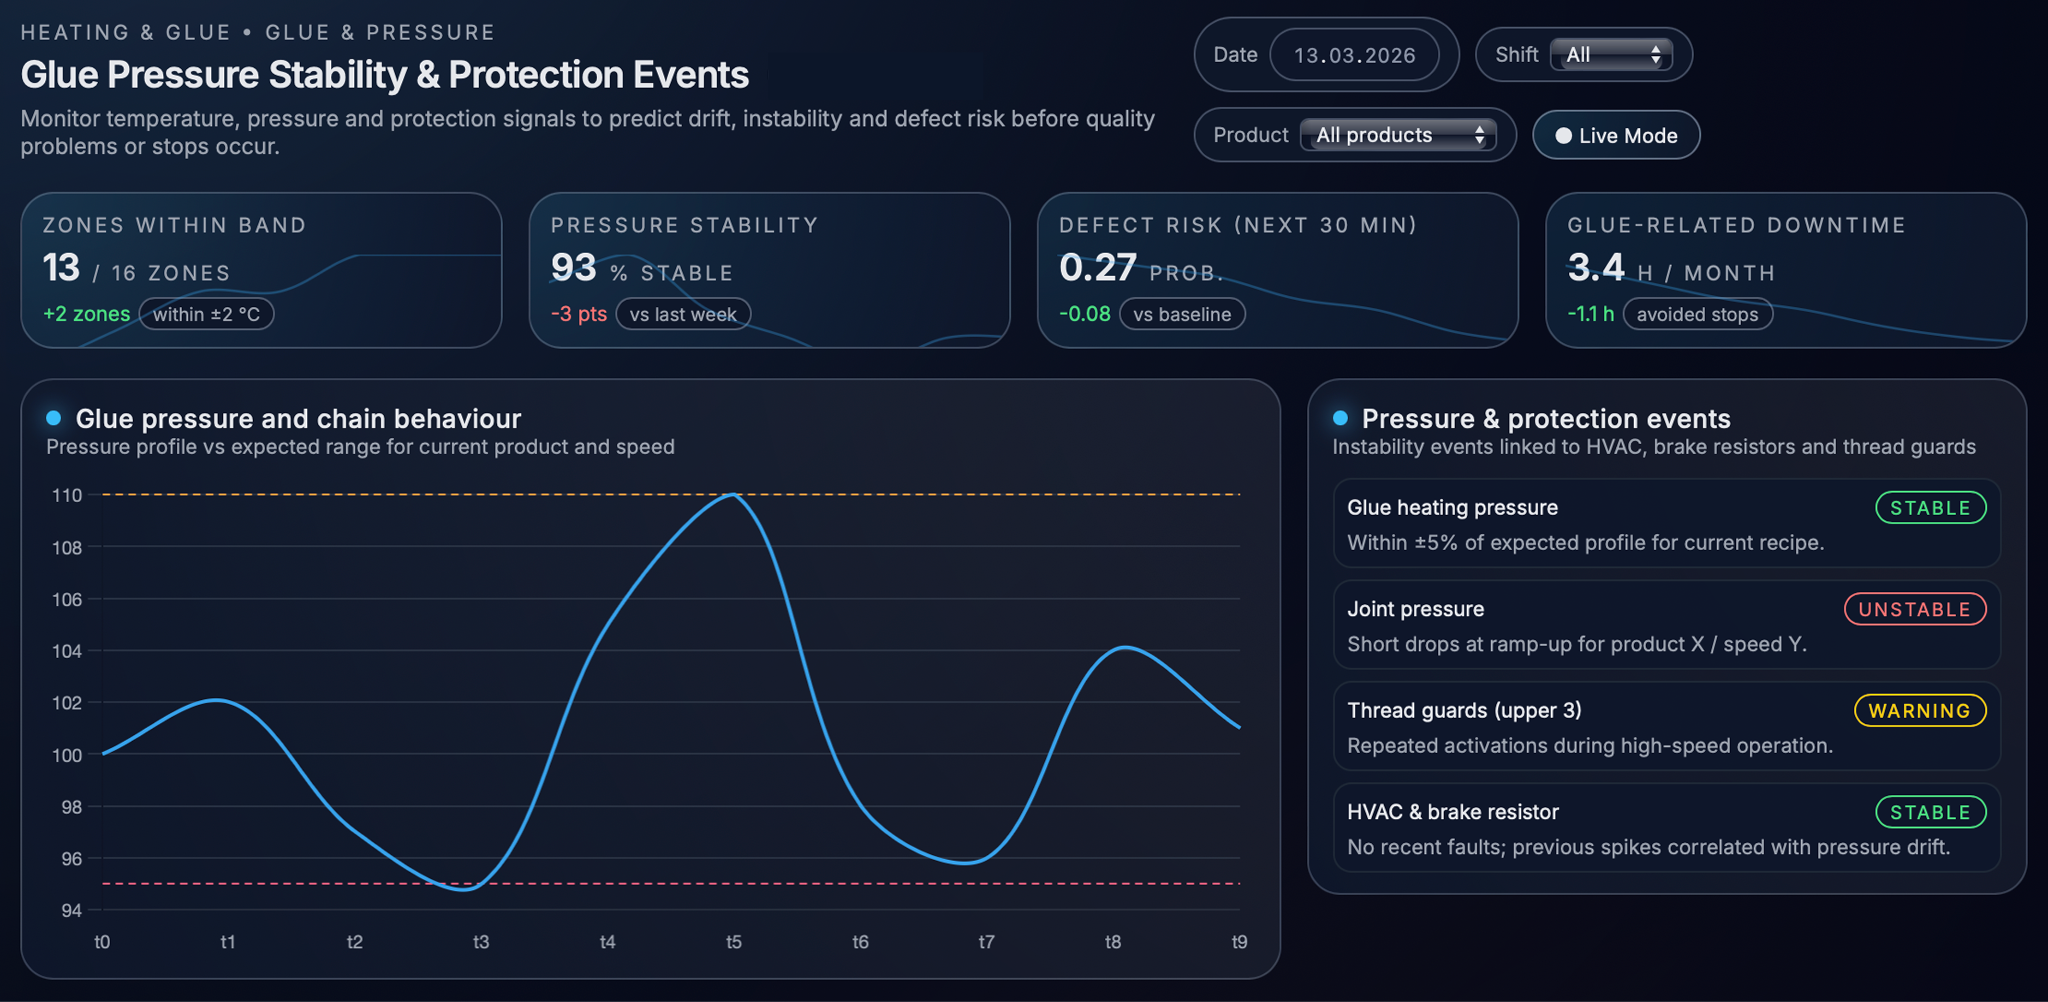
The predictive maintenance results are shown in dashboards and alerts that fit into the daily work of operators, engineers, and maintenance teams on the production line. Operator screens show the current condition of the heating and glue system in real time, including pressure stability, temperature status, and active alarms. Clear colour indicators make it easy to see whether the system is working normally or if attention is needed. Operators can also view short-term trends to understand if a change was just a small fluctuation or the start of a bigger problem. For engineers, additional dashboards provide more detailed information, such as zone health status, temperature behaviour over time, and estimated risk of instability. This helps to analyse problems and improve process settings.
The system also generates alerts based on defined rules. Each plant can set its own limits for what should be considered normal, warning, or critical. For example, an alert can appear if a heating zone needs longer than usual to reach temperature, if the temperature moves too far from the setpoint, or if pressure becomes unstable for the current production conditions. Each alert includes a short explanation and suggested actions, such as checking heaters, cleaning glue parts, or verifying air and cooling systems. If the system is connected to maintenance software, alerts can automatically create work requests with all needed information, including trends and event history, so technicians know what to check before they start the work.
After maintenance is done, the action can be recorded in the system together with notes about what was changed or repaired. This feedback helps the predictive models learn what normal behaviour looks like after service and improves future predictions. Over time, the system becomes more accurate, reduces unnecessary warnings, and builds knowledge about typical wear and failures for the production line. As a result, maintenance can be planned based on real condition and risk instead of fixed schedules, which helps keep the process stable and reduces unexpected downtime.
Conclusion
The implementation of predictive maintenance for the heating and glue system on the production line has led to clear improvements in both quality and reliability. By continuously monitoring temperatures, pressure, and alarm signals, and by detecting drift or instability before they turn into defects or stops, the solution helps reduce quality issues and unplanned downtime. The process becomes more stable and predictable, because problems can be seen early instead of after a failure already happened. Engineers can easily see which zones behave differently from normal, maintenance teams can plan work during scheduled stops instead of reacting to emergencies, and operators get real-time feedback that helps them keep the process within the correct limits. This change from reactive work to data-driven decisions reduces scrap, lowers maintenance costs, and makes production planning more reliable.
In addition to daily operational benefits, this use case changes the maintenance approach itself. Instead of relying only on fixed service intervals or waiting for equipment to fail, maintenance can now be planned based on the actual condition of the system. Actions such as calibration, cleaning, or part replacement are done when the data shows they are needed. This helps avoid unexpected failures and also prevents replacing parts too early. Each completed maintenance action is recorded, and this information is used to improve the prediction models. Over time, the system learns typical wear patterns and failure behaviour, which makes future warnings more accurate and useful.


Our success stories


.avif)


Tell us about your project needs


.png)
.png)