


The table of content
Introduction
The purpose of this use case is to stabilise the flow of material between FC, CVX, storage and lift tables so that panels move smoothly through the line without frequent stops or sudden rushes. When flow is stable, throughput increases without new machines, operators feel less pressure to constantly “babysit” buffers, and the line becomes more predictable from shift to shift. Instead of treating blocking and starvation as random noise, the use case turns them into measurable, controllable phenomena that can be improved through clear rules and digital‑twin experiments.
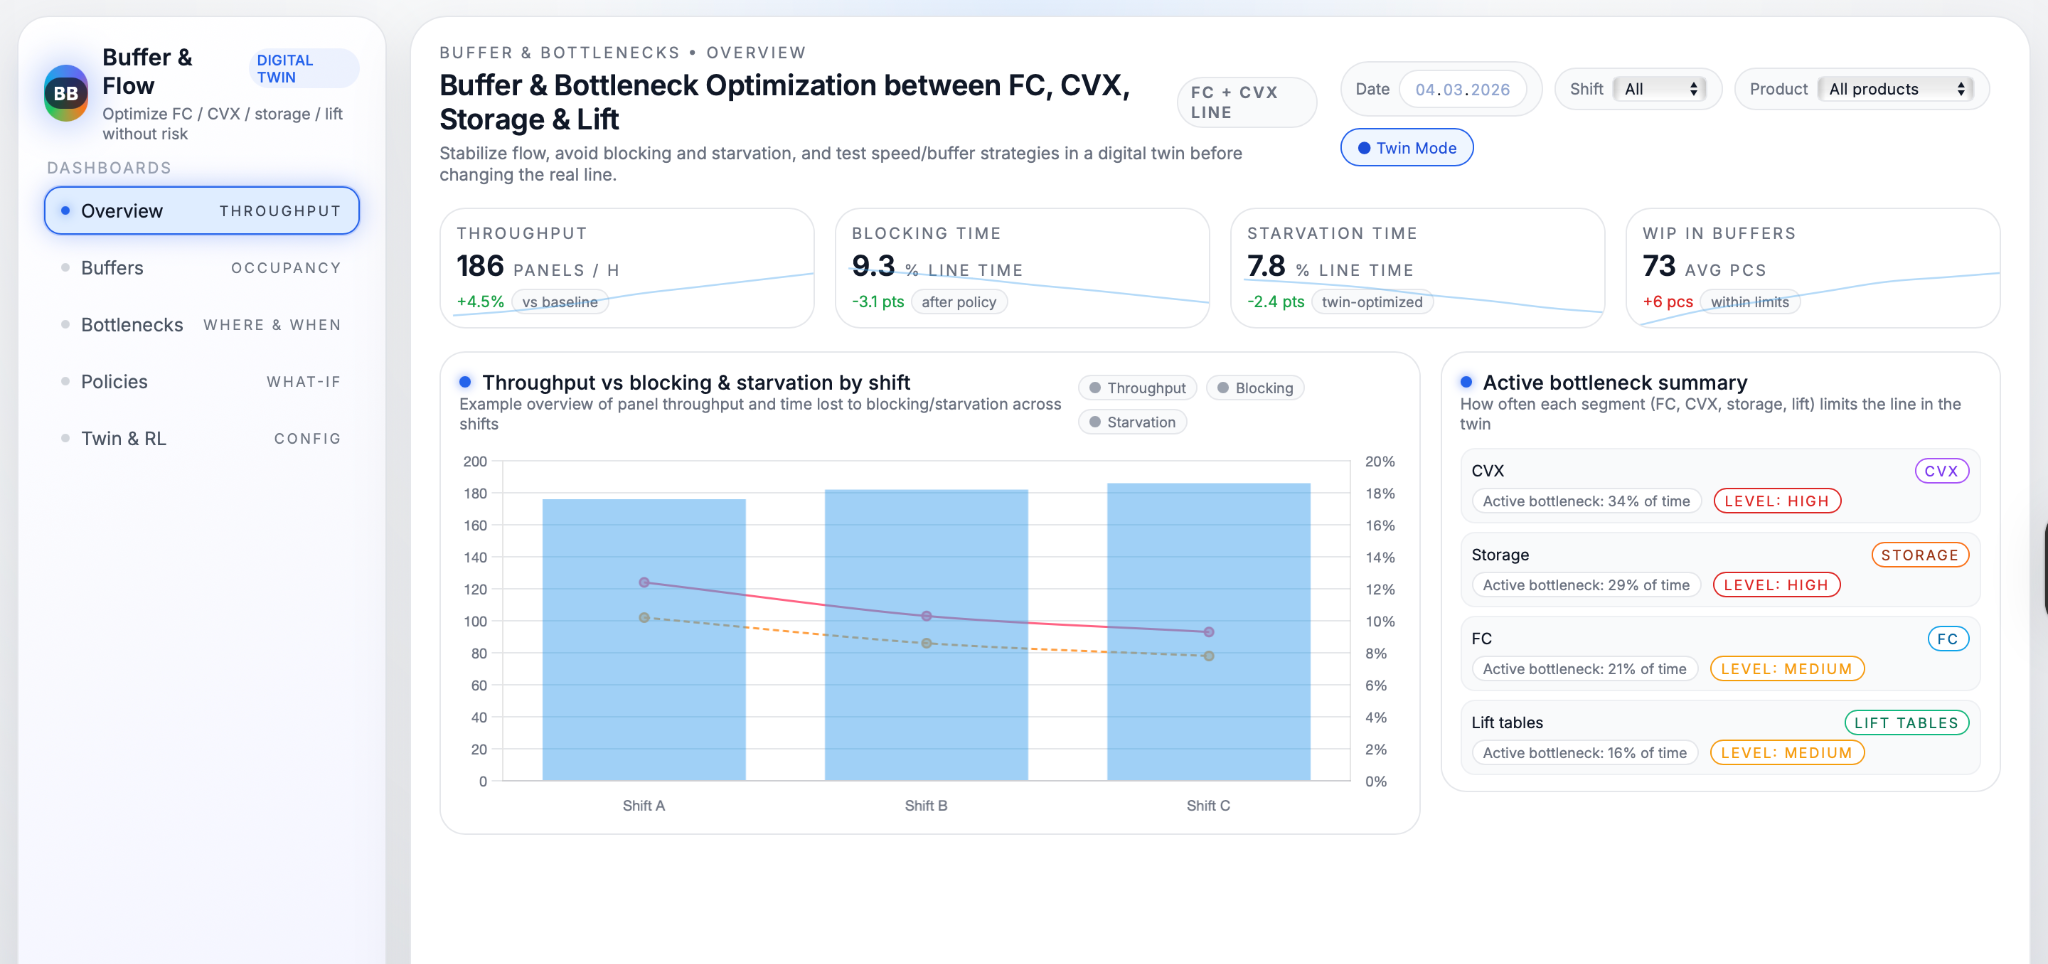
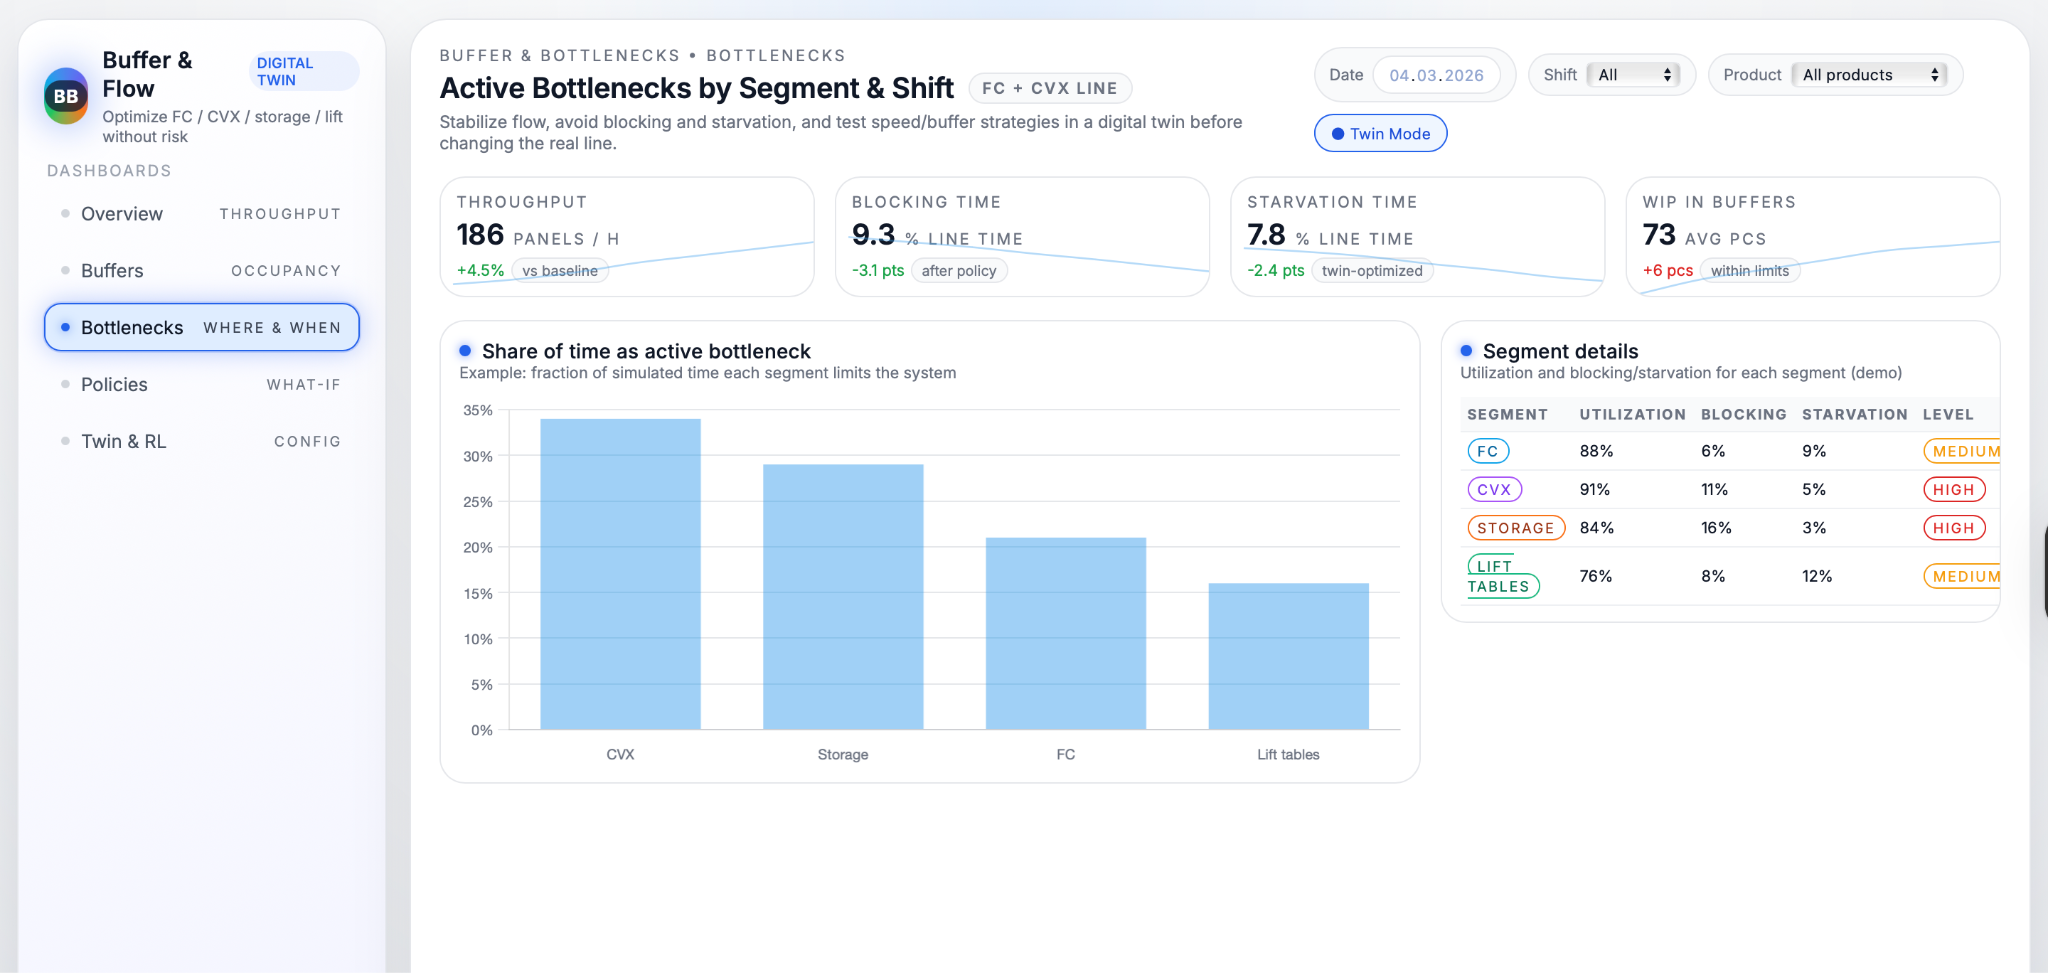
Buffers and bottlenecks are central because they quietly decide how much of the installed capacity the factory actually uses. If storage fills up too often, FC or CVX are forced to wait even though they could run faster; if buffers run empty, downstream segments sit idle and lose output they could have produced. On the FC + CVX line, the active bottleneck can shift between CVX, storage, FC and lift tables depending on product mix, speed settings and stack sizes, which makes it hard to optimise by intuition alone. By mapping where and when each segment becomes the bottleneck, the use case shows exactly which part of the line limits throughput and how buffer policies and speed settings should change to keep the whole system in balance.
Data Used
Event data along the FC–CVX–storage–lift path
To understand how material really flows through the FC + CVX line, the system listens to the signals that already exist along the path from FC to CVX, through storage, and finally to the lift tables. It tracks when panels arrive at the CVX infeed, when they leave towards storage, when the intermediate transport declares itself full, and how individual storage positions are used. It also records stack input and output movements, clamp positions, “stack not in position” states, and lift‑table position switches, together with line‑speed and creep‑speed settings, product type, order and shift. Seen together, these signals describe not only where panels are, but also when parts of the line are blocked by full buffers or starved because no material has arrived yet.
Converting raw PLC signals into an event log
All of these PLC bits and sensor states are time‑stamped and transformed into a clean event log that describes what happens on the line in the order it actually occurs. Instead of thousands of low‑level signals, the event log contains higher‑level events such as “panel entered CVX infeed,” “intermediate buffer became full,” “lift table reached load position,” or “stack not in position activated.” This structured timeline is what drives and validates the discrete‑event digital twin: it is used to estimate realistic processing and transfer times, to infer buffer capacities and typical blocking/starvation durations, and to check that the simulated system reproduces the same patterns of throughput, WIP and waiting time as the real line. Once this alignment is achieved, the same event framework becomes the basis for analysing bottlenecks and testing new buffer and speed policies in simulation.
Technical Realisation
Discrete‑event digital twin of FC, CVX,
storage and lift
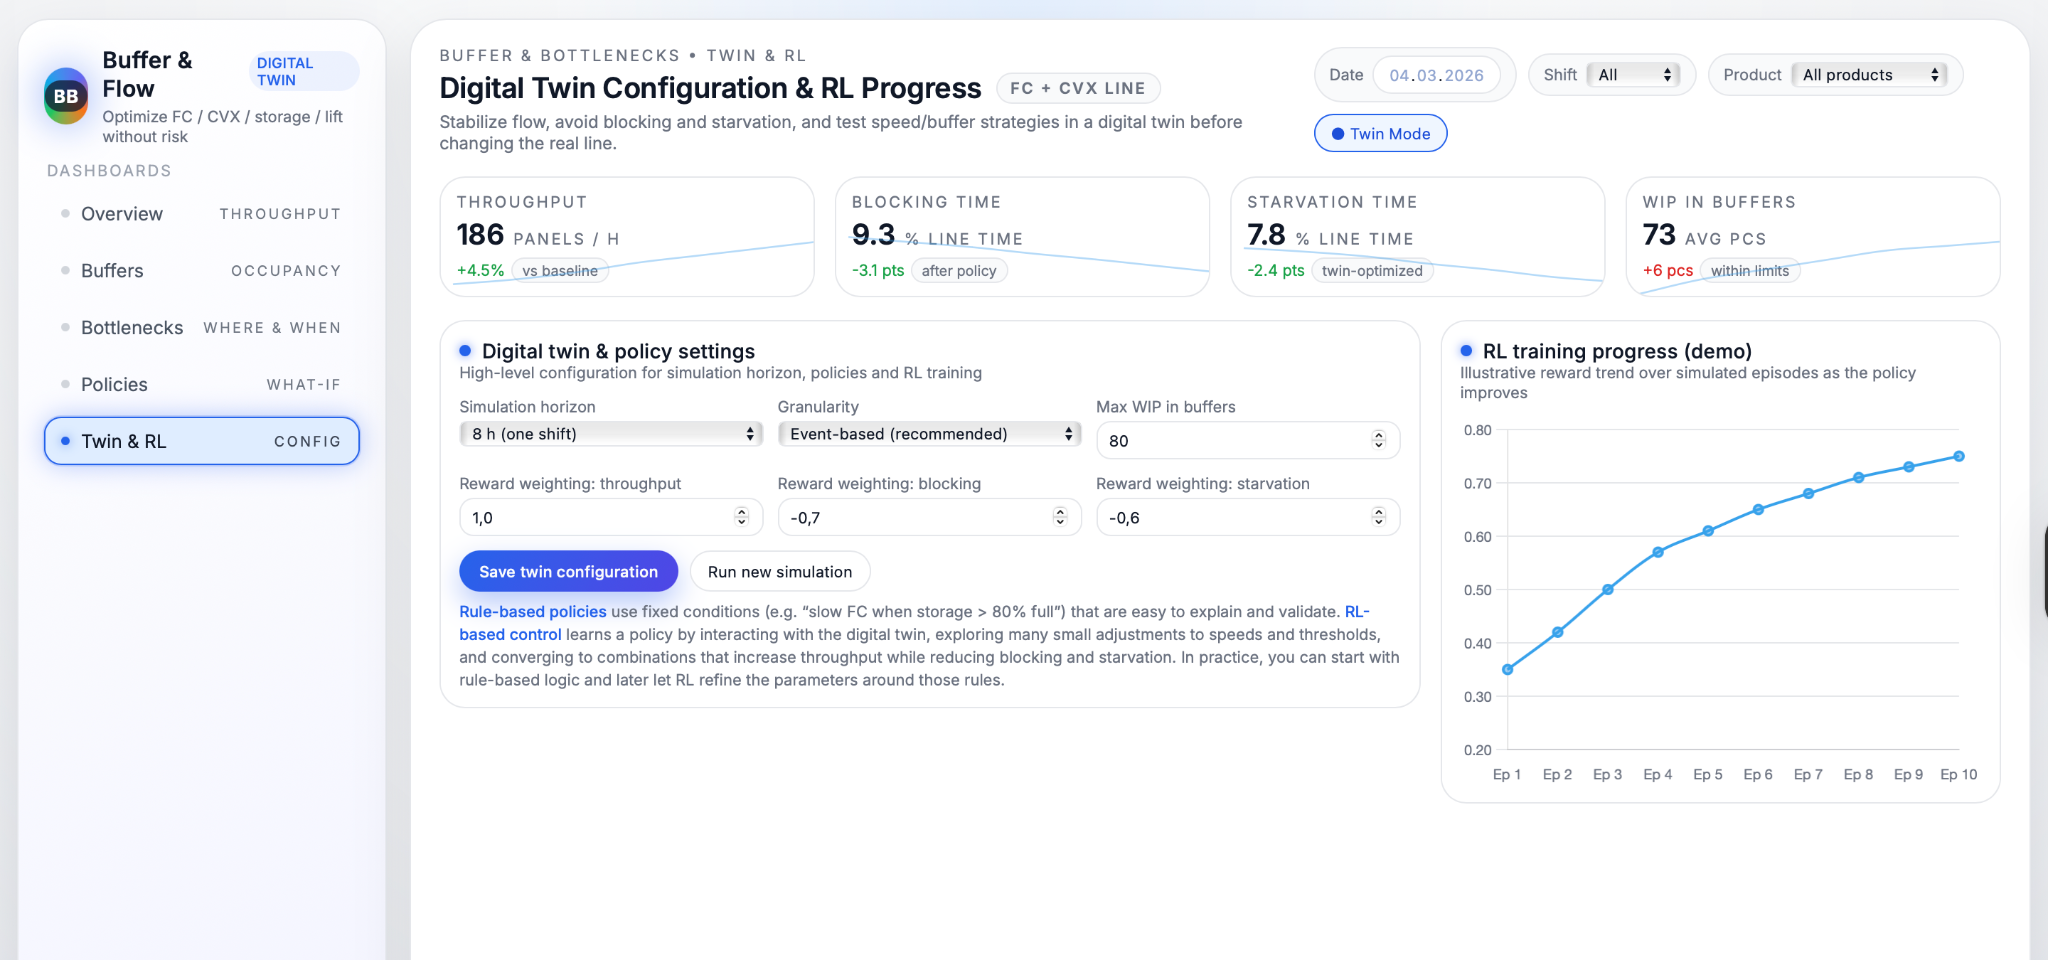
At the core of this use case is a discrete‑event digital twin that mirrors how panels move through FC, CVX, storage and lift tables. Each station is modelled as a “server” with processing times taken from real cycle‑time data, while intermediate belts and storage positions are represented as buffers with capacities inferred from their full/empty behaviour. Logical rules from the PLC, such as “do not load when stack is not in position,” “clamp must be open to unload,” or “lift must be at load level before transfer,” are built into the twin so that simulated blocking and starvation arise for the same reasons as on the real line. The model is tuned until simulated throughput, WIP and waiting times match what is observed in production closely enough to be trusted for what‑if analyses.
Bottleneck and buffer analytics in the twin
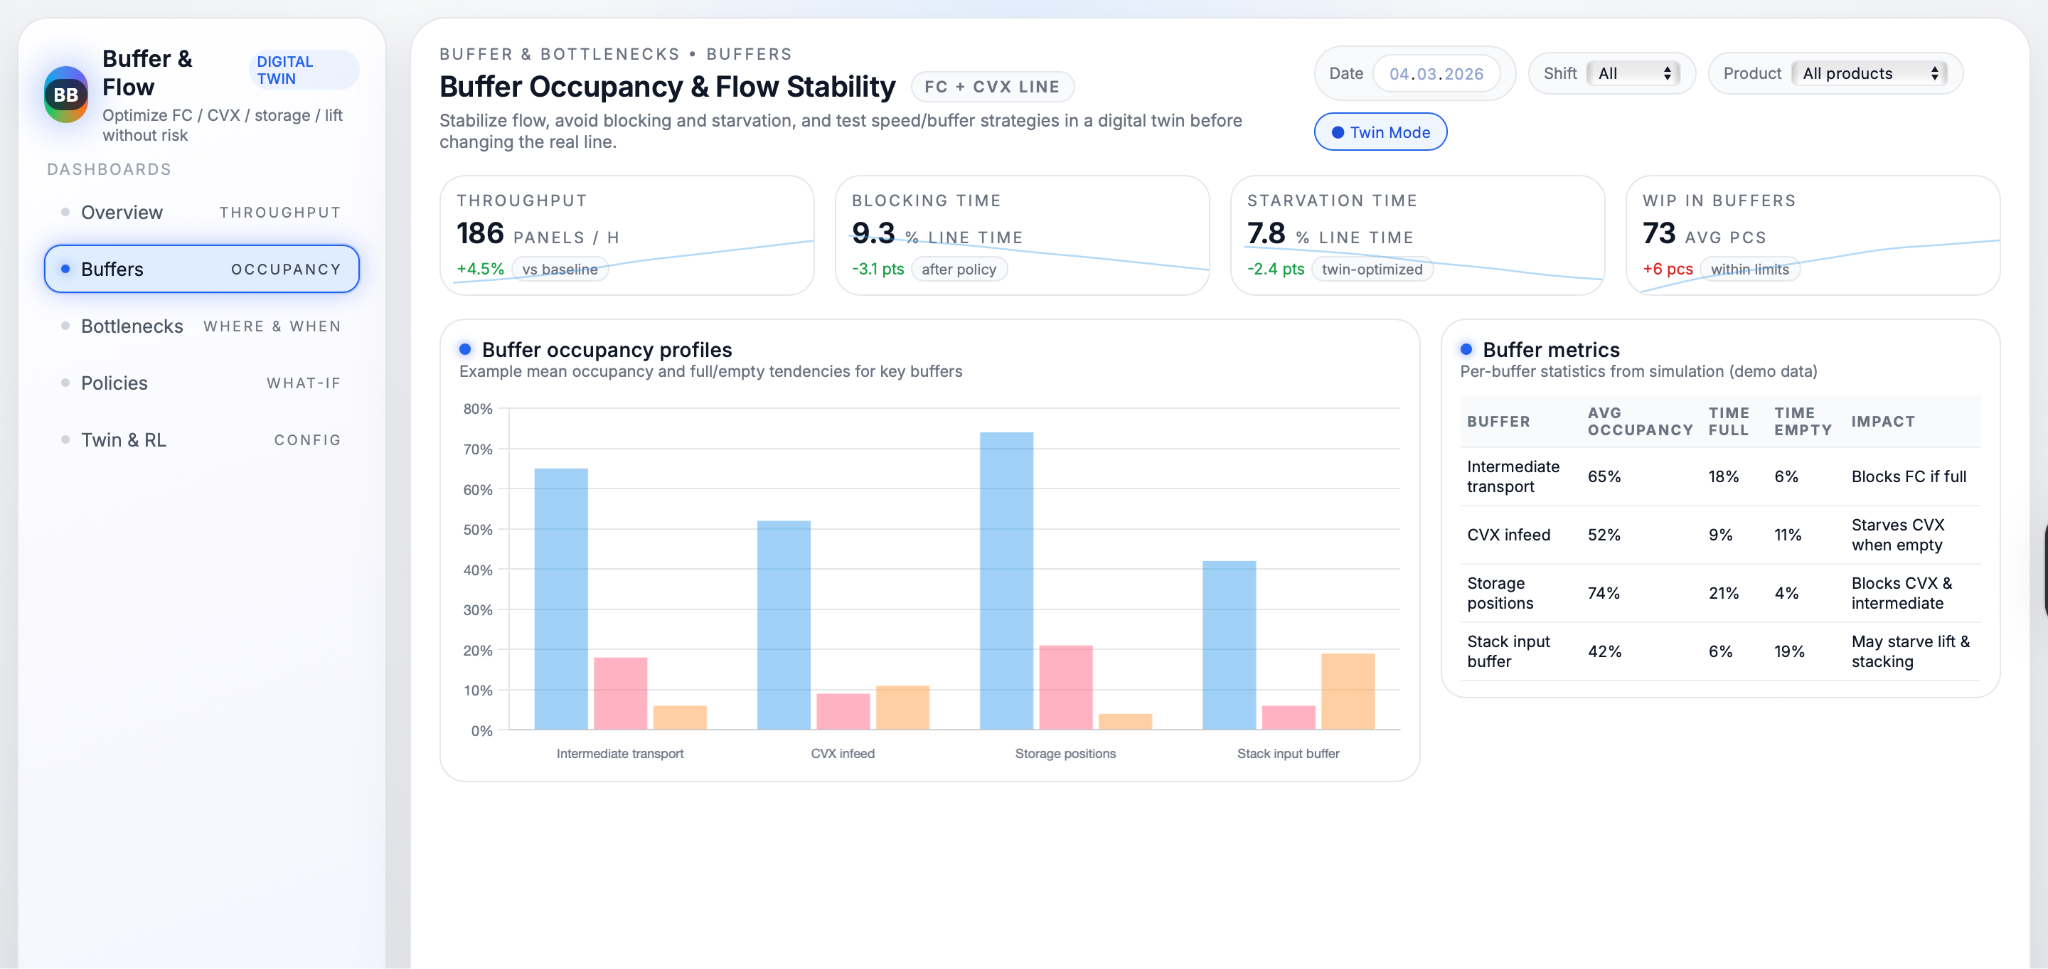
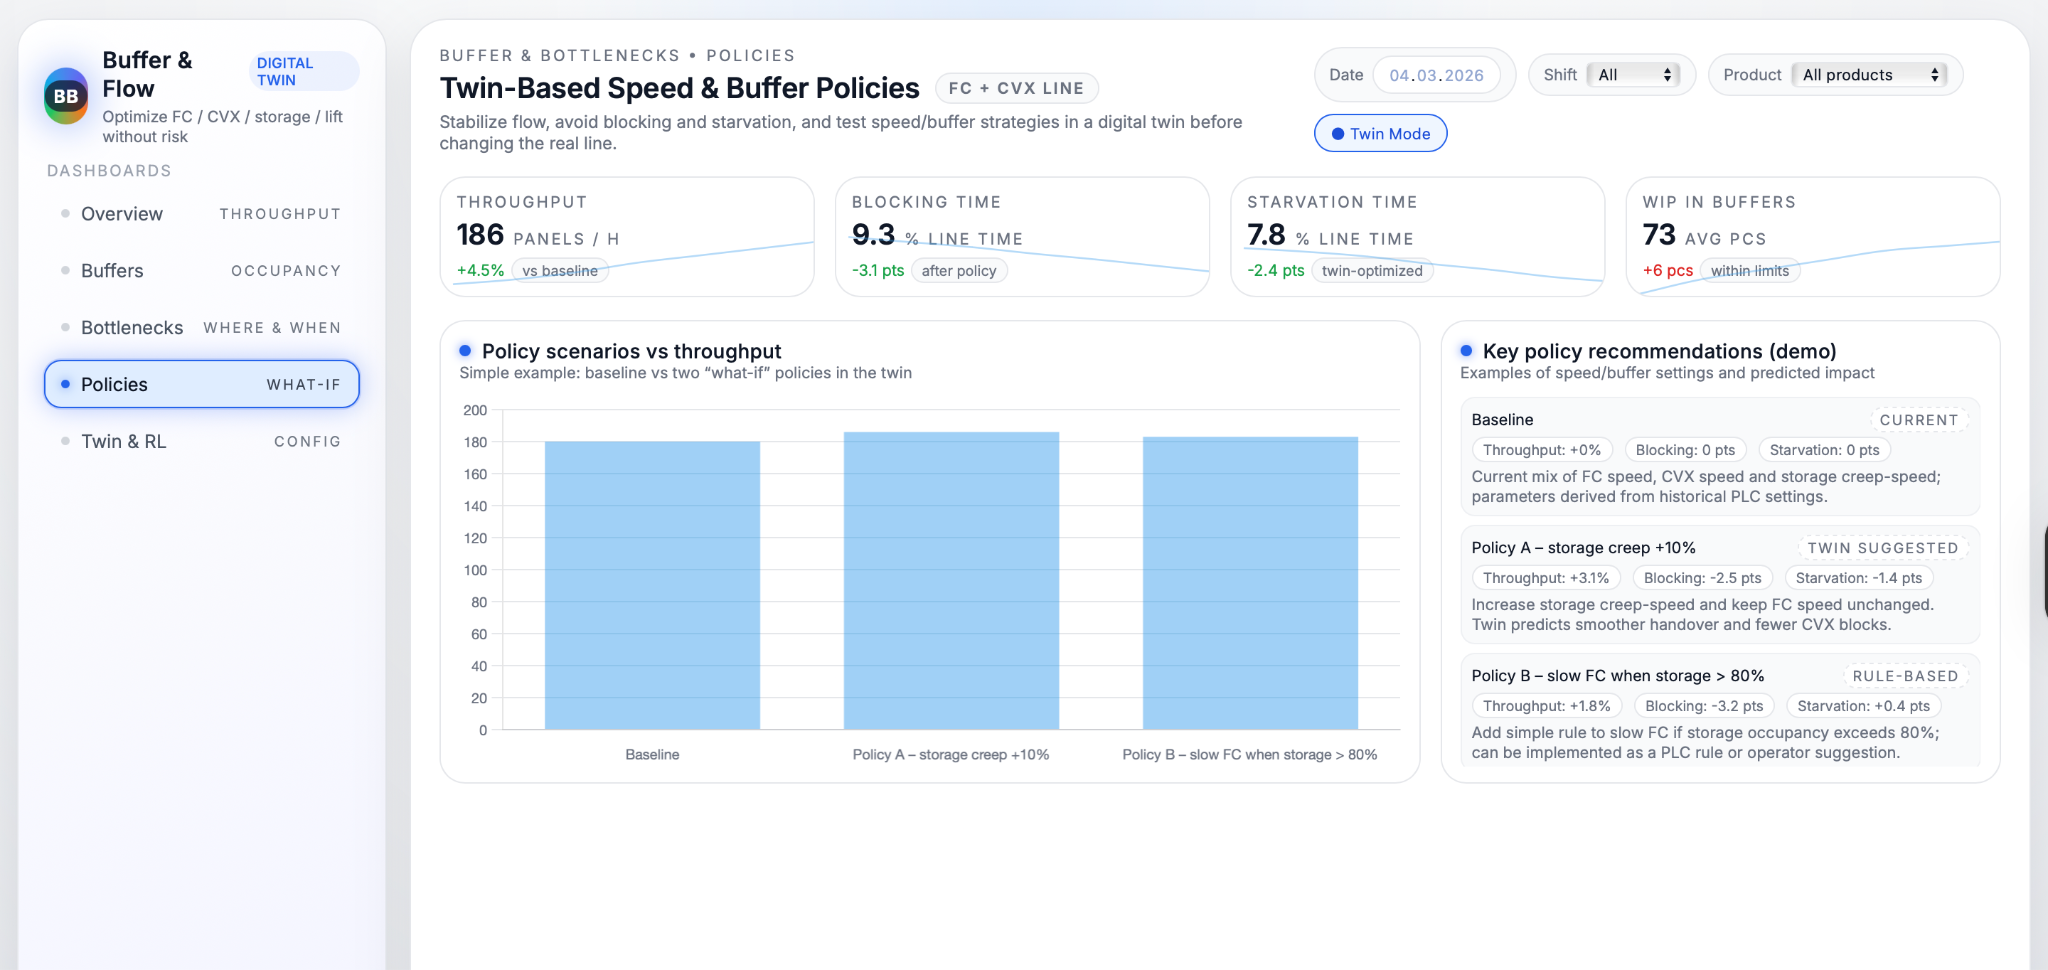
Once the twin behaves like the real system, it becomes a safe environment for detailed bottleneck and buffer analysis. For every simulated shift, the model records how much time each segment (FC, CVX, storage, lift) spends busy, waiting because upstream is empty (starved), or blocked because downstream is full. From this, it calculates how often each station acts as the active bottleneck and how this changes with different products, speeds and stack sizes. At the same time, each buffer’s occupancy is tracked over time, including the share of time it is full or empty and how often states such as “intermediate transport full” or “stack not in position” directly cause FC or CVX to wait. These metrics reveal structurally over‑used or under‑used buffers and show where small changes in capacity or control could have the biggest effect on flow stability.
AI‑based speed and buffer policy optimization
On top of the calibrated twin, AI methods search for better ways to control speeds and buffers without risking the real line. Simple versions test fixed rules such as “slow FC when storage occupancy exceeds 80%” or “increase storage creep speed when CVX output is frequently waiting” and compare their impact on throughput, blocking and starvation. More advanced versions use reinforcement learning, where an agent repeatedly runs simulated shifts, trying different combinations of speed and buffer thresholds, receiving rewards for higher throughput and lower blocking/starvation, and gradually converging on effective policies. Because all of this happens in simulation, the system can explore thousands of variations and identify a small set of rules that deliver clear improvements, such as “for product A, increasing storage creep speed by 10% and slowing FC at 80% buffer level reduces FC starvation by around 7% while increasing throughput by roughly 3–4%.” These policies can then be reviewed by engineers and, once accepted, implemented as PLC logic or operator guidelines on the real FC + CVX line.
Dashboards and Operator Support
Visualising bottlenecks,
blocking and starvation
The dashboards turn the results of the digital twin into views that are easy to read during day‑to‑day work. For each shift, they show how panel throughput compares with the percentage of time lost to blocking and starvation, so teams can immediately see whether flow problems are getting better or worse. A dedicated bottleneck section highlights which segment—FC, CVX, storage, or lift tables—acts as the main limiter over time, making it clear where attention and improvement projects should focus instead of relying on gut feeling.
Buffer metrics and occupancy profiles
Buffers get their own set of metrics, because they are the “shock absorbers” of the line. Occupancy profiles show the typical fill level for each key buffer, together with how often it is full (blocking upstream) or empty (starving downstream). Tables next to the charts explain the impact of each buffer, for example “Intermediate transport: blocks FC when full” or “CVX infeed: starves CVX when empty,” so engineers and operators can quickly understand what a high “time full” or “time empty” value really means. This combination of charts and plain‑language explanations helps everyone see whether buffers are doing their job or whether they need different speed settings, capacity, or control rules.
Policy recommendations
and workflow integration
To make the optimisation work usable on the shopfloor, the system summarises the best‑performing policies as simple, product‑specific recommendations. For each product or family, it might propose settings such as “storage creep speed = X, FC slowdown threshold at Y% storage occupancy, CVX speed Z,” alongside expected effects like “throughput +3%, FC starvation −7%, storage blocking −5%.” These recommendations can be turned into standard parameter tables in the production handbook, into recipes in the control system, or into advisory messages on operator screens. They are reviewed and updated periodically—such as once per quarter—so that buffer and speed policies stay aligned with the current product mix and demand pattern rather than becoming a one‑off tuning exercise.
Business Value
Higher throughput without major CAPEX
By reducing the time the line spends blocked or starved, the use case increases the number of panels that FC and CVX can process with the equipment you already have. Instead of investing in new machines, the factory unlocks extra effective capacity simply by running the existing line in a more balanced way. This makes it easier to handle higher demand or absorb peaks without large capital projects.
More stable flow and lower operator stress
When buffers and speeds are tuned properly, material moves through the line in a steadier rhythm, with fewer sudden stops and urgent restarts. Operators no longer have to constantly “play the buffers” by intuition, deciding on the fly when to slow FC or nudge storage creep speed. Clear, validated rules and better visibility mean fewer fire‑fighting moments, smoother shifts, and a calmer working environment.
Better bottleneck visibility
and targeted improvements
The digital twin and dashboards make shifting bottlenecks visible instead of hidden in day‑to‑day noise. Teams can see exactly which segment—FC, CVX, storage, or lift—is limiting throughput in different scenarios, and by how much. This allows improvement efforts and maintenance investments to be directed precisely where they have the most impact, rather than spreading time and budget across the line based on guesswork.
Continuous optimization
with evolving data and policies
Because the system is driven by live data and a configurable twin, it does not stop delivering value after the first tuning round. As product mix, speeds, or operating practices change, new data feeds back into the model, and buffer and speed policies can be re‑evaluated and improved. Over time, this creates a continuous‑improvement loop, where the line is periodically re‑optimised and the gap between theoretical and actual throughput keeps narrowing.
Conclusions
The Buffer & Bottleneck Optimization use case shows how a digital twin and simple policy logic can turn a complex flow problem on the FC + CVX line into something visible, measurable, and improvable. By translating raw PLC signals into an event‑driven model of FC, CVX, storage and lift tables, it becomes possible to replay how panels move through the system, see exactly where blocking and starvation occur, and test alternative speed and buffer strategies without touching the real equipment. What used to be handled through operator intuition and trial‑and‑error becomes a structured process where hypotheses are checked in simulation, the best options are selected, and only then are they rolled out to production with clear expectations on their impact.
In practical terms, this brings several benefits at once: higher throughput from the existing line, more stable flow, less operator stress, and a much clearer view of which segment is the true bottleneck at any given time. Just as importantly, it creates a framework for continuous optimisation: as new products, speeds, or layouts are introduced, the same twin and policy engine can be updated, re‑run and used to refine rules again. Over time, the FC + CVX line moves away from one‑off tuning projects and towards an ongoing, data‑driven way of managing buffers and bottlenecks, where improvements can be quantified and explained instead of relying on gut feeling.


Our success stories


.avif)


Tell us about your project needs


.png)
.png)