


The table of content
Introduction
Why drives and motion axes matter
On the production line, many moving parts must work together smoothly. Cutting units, conveyors, lift tables, and positioning mechanisms all have to move at the right time and at the right speed. If one of these movements becomes slow or unstable, it can affect the whole process. Typical problems include worn mechanical parts, drives that struggle to reach their position, or units that need several attempts before completing a movement. When a drive finally fails, the line can stop without warning, repairs become urgent, and production schedules may be affected.
This predictive maintenance use case focuses on detecting such problems early, long before a failure happens. Instead of waiting for alarms or breakdowns, the system monitors how each movement behaves during normal operation. It tracks how long motions take, how often movements need to be repeated, how frequently slow or safety speeds are used, and whether warnings appear more often than usual. From this information, the system calculates a simple health status and risk level for each important drive or motion axis. This makes it easier to see which components are working normally and which ones may need attention soon.
With this visibility, maintenance teams can plan inspection, lubrication, adjustment, or part replacement during scheduled stops instead of reacting to unexpected failures. Production staff can also see which parts of the line are becoming risky over time and prepare in advance. Because the solution mainly uses signals that are already available from the control system, the factory can move from reactive maintenance to proactive equipment management without needing major hardware changes at the start.
Data and Health Indicators per Drive/Axis
What data the system uses
To understand the condition of each drive or motion axis, the system uses data that the production line already collects during normal operation. It reads basic drive states such as running, stopped, or fault, as well as movement commands and the feedback confirming that a position has been reached. Signals from limit switches, position sensors, and safety protections are also included, together with alarms such as overheating or electrical faults.
In addition, the system monitors air pressure and other signals that can affect how smoothly the movements run. Simple context information is also used, for example how long a drive has been working, how many cycles it has completed, and when it was last serviced.
All this information creates a continuous history of how each component behaves over time, making it possible to see changes in performance and detect early signs of wear or instability.
How health indicators are calculated
From this history, the system calculates simple health indicators that are easy to understand. For each movement, it measures how long it takes from the moment a command is given until the position is reached, and checks whether this time is slowly increasing over days or weeks. It also counts how often a motion has to be repeated, how frequently slow or safety speed is used instead of normal speed, and how often temperature, pressure, or other warnings appear.
The system also looks for patterns, for example whether movements become unstable when compressed air pressure is low or fluctuating. This helps detect problems that are not caused by the drive itself but still affect how the motion works.
All these observations are combined into a small set of health values that show how heavily each drive or axis is working compared to its normal behaviour in the past. This makes it easier to see which components are still in good condition and which ones may need attention soon.
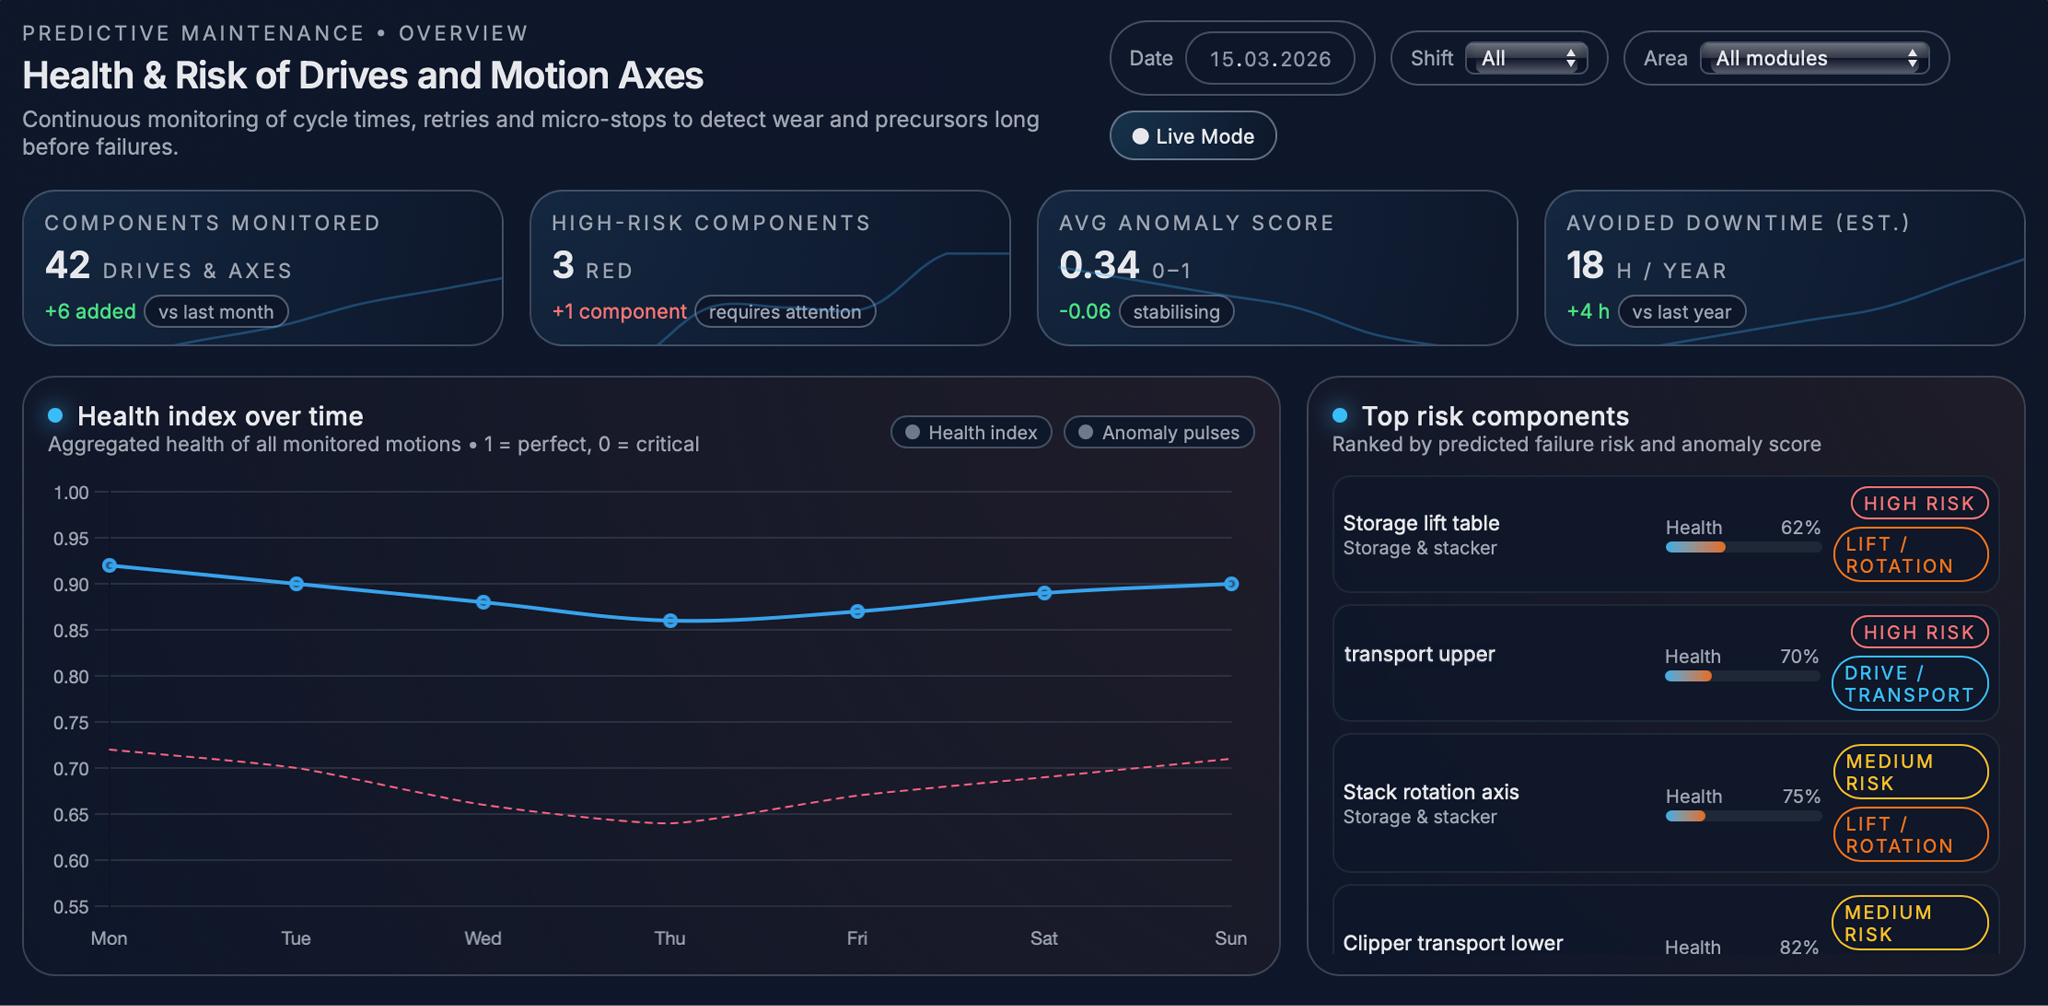
Health profiles and anomaly scores in the UI
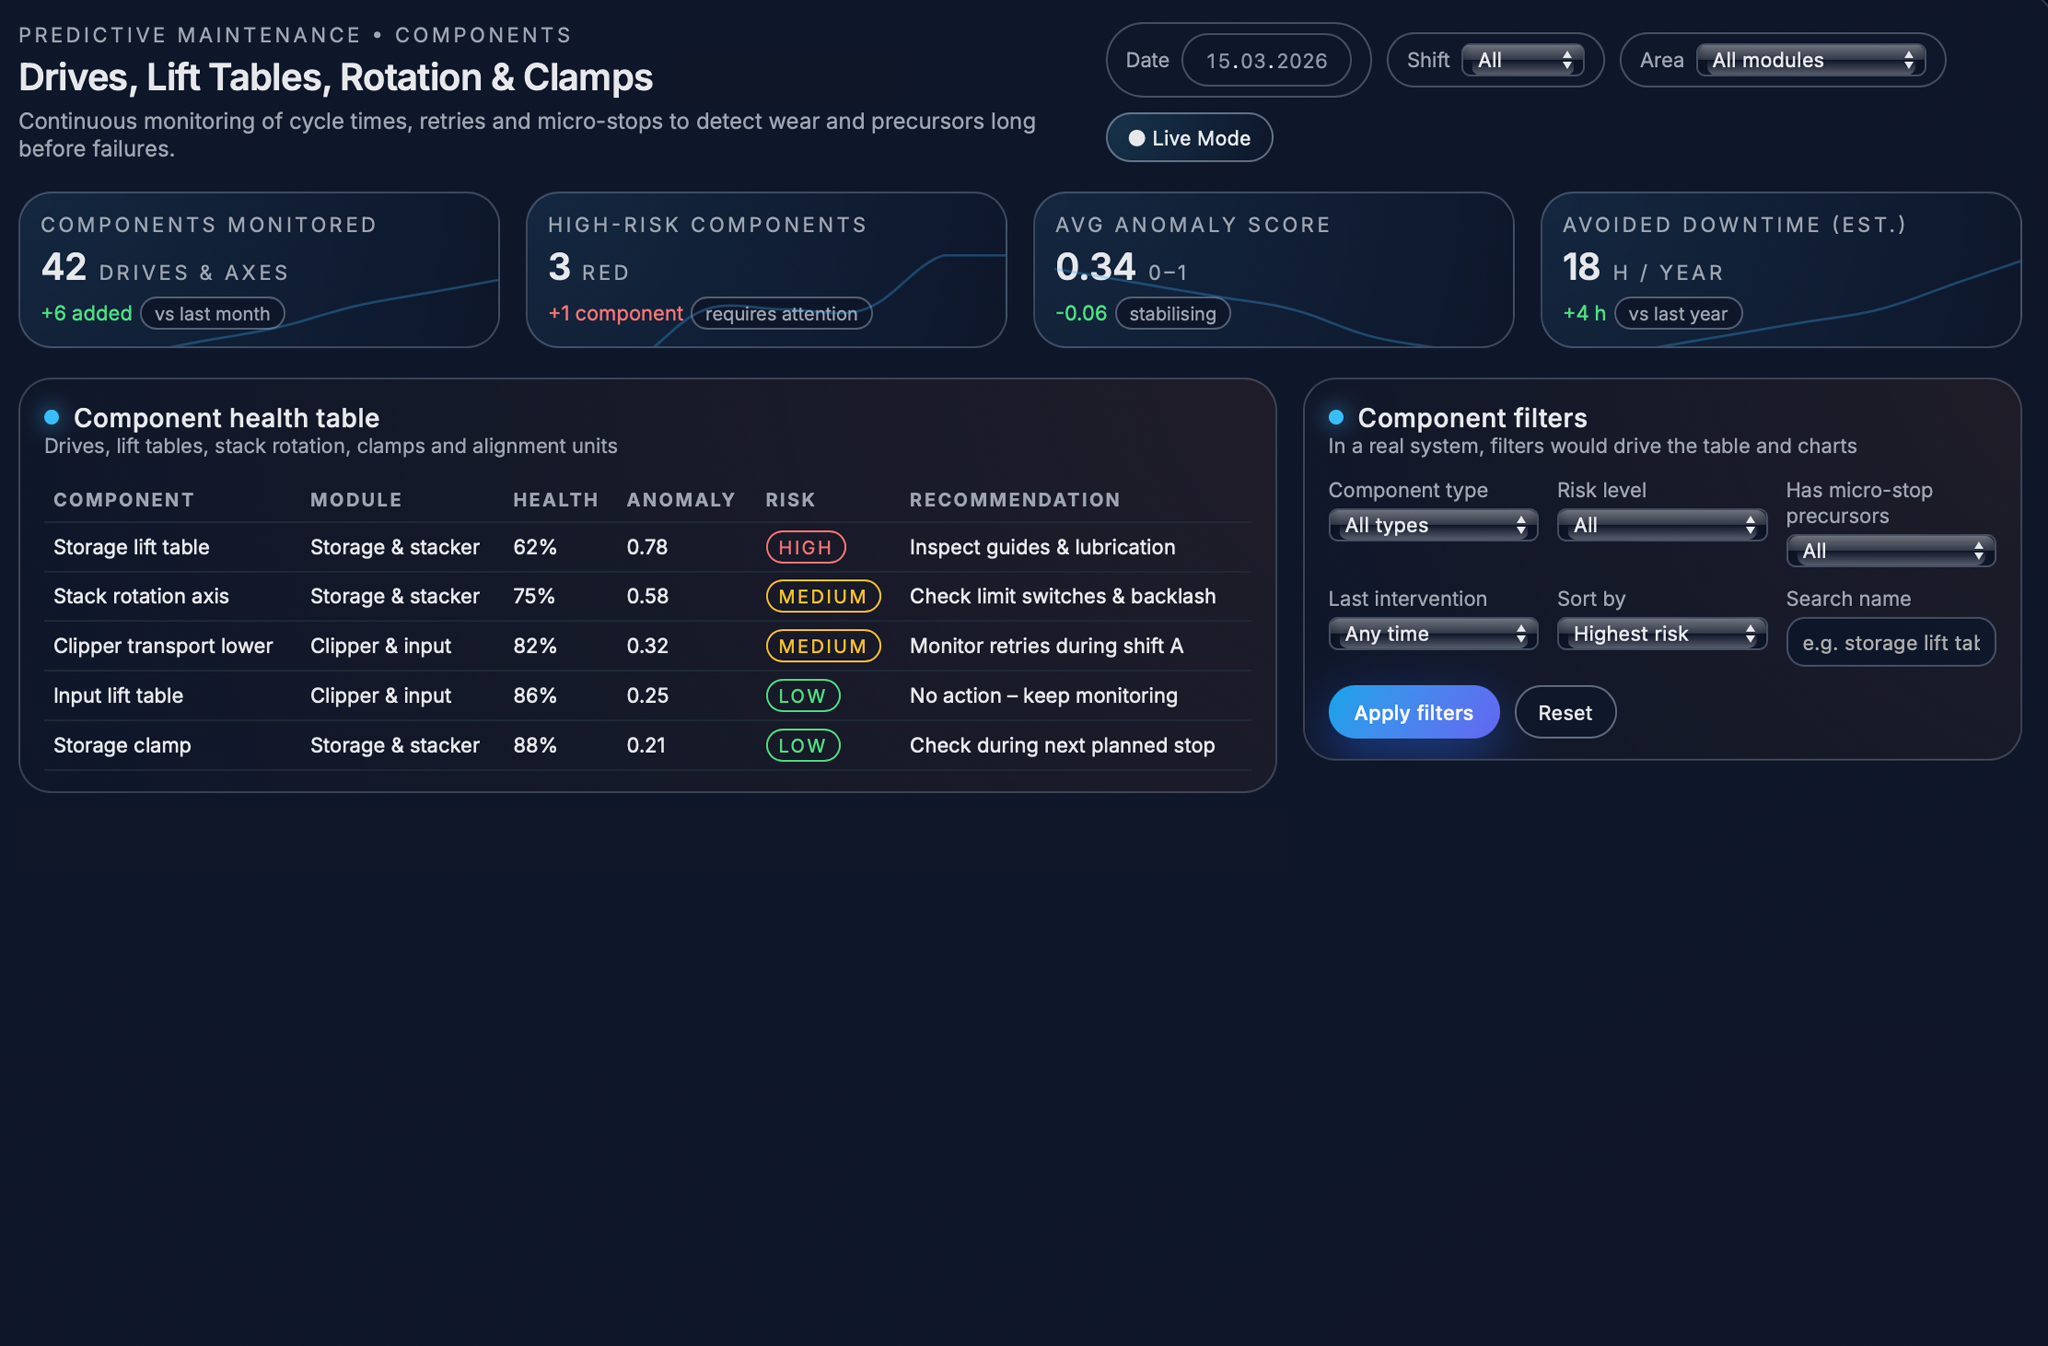
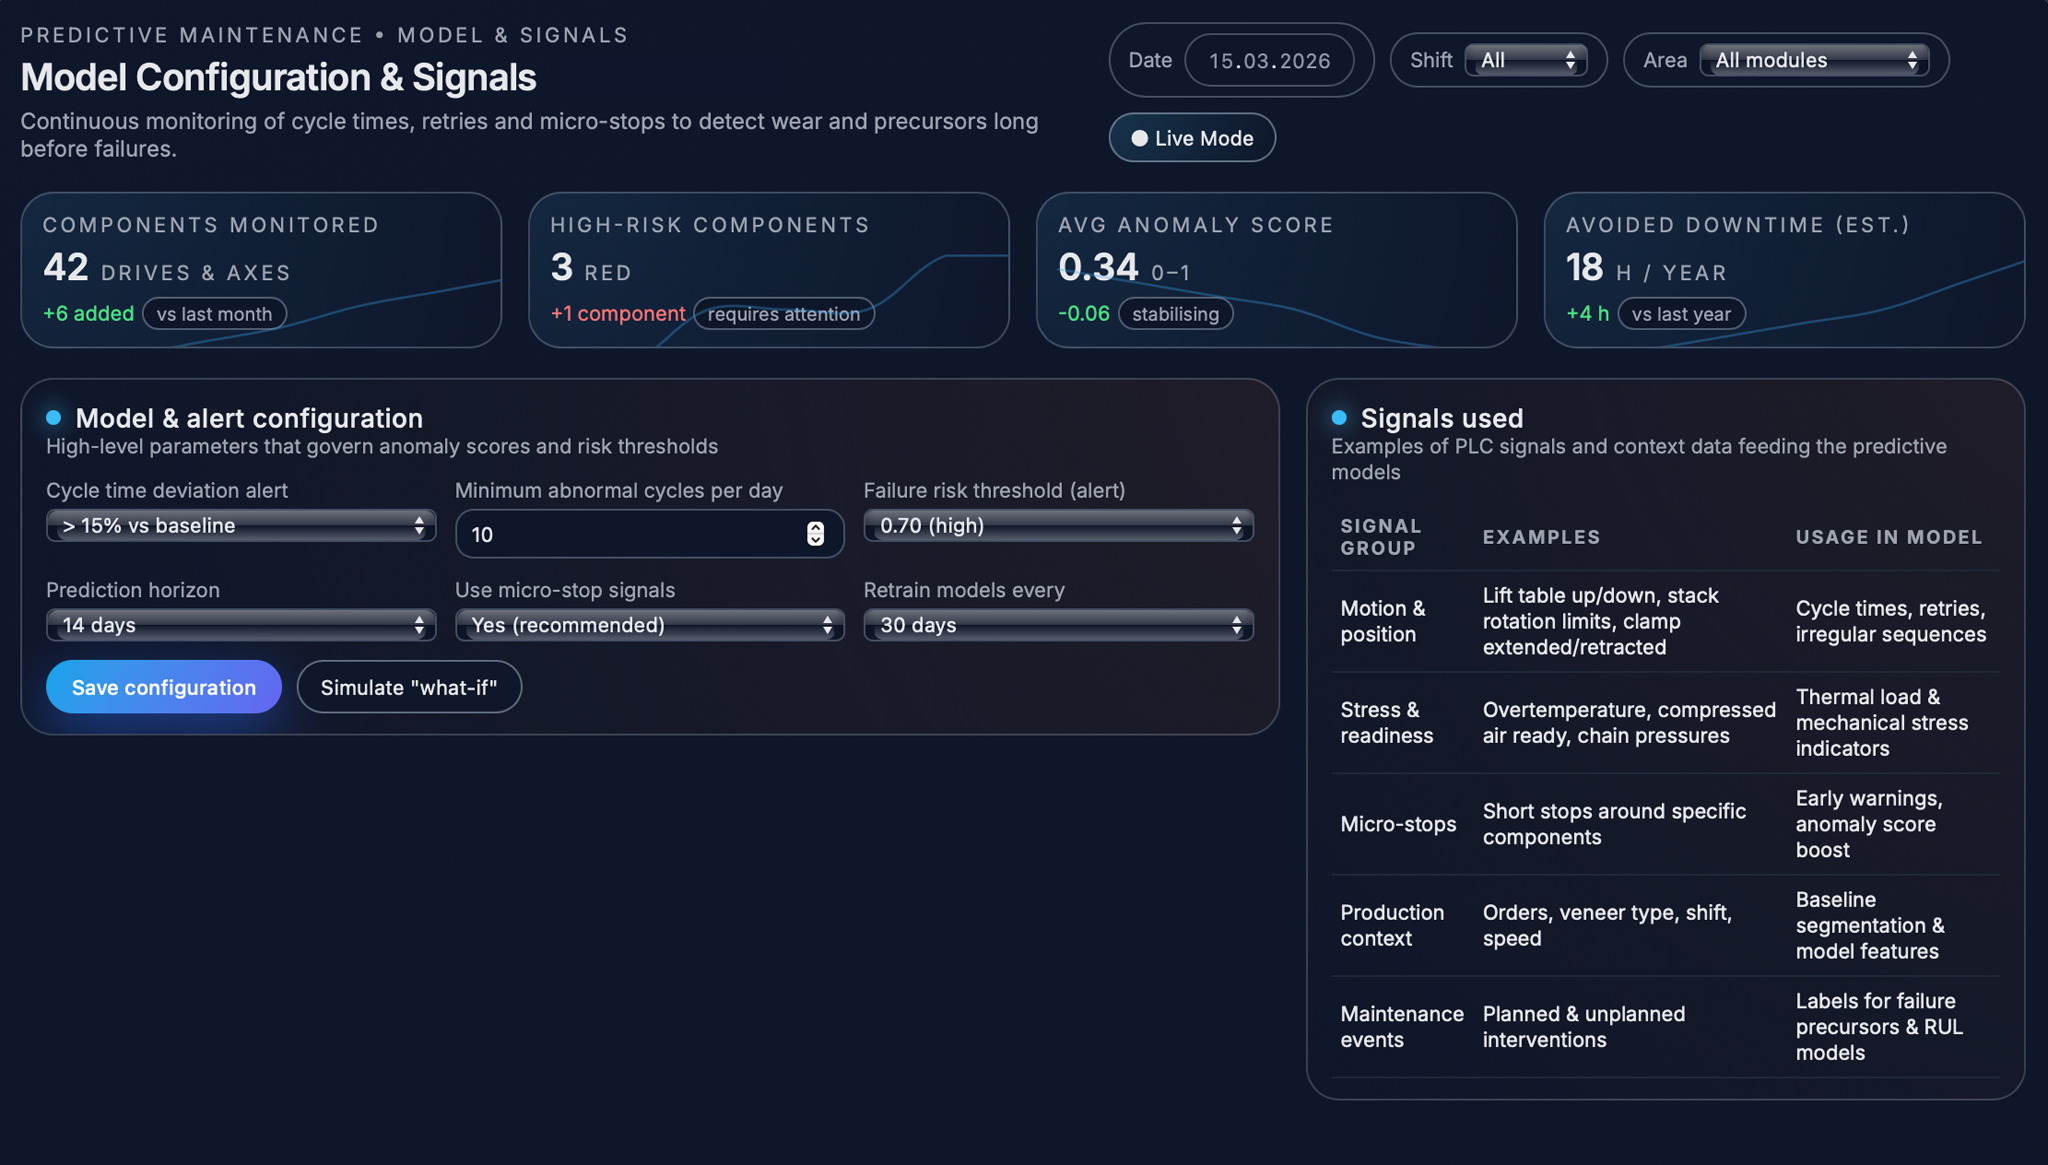
All these indicators are stored for each component and shown as a health profile that changes over time. For every drive or motion axis, the system calculates a health score that increases when movements become slower, retries happen more often, or warning events appear more frequently. In the dashboard, this information is shown in a simple table where each component has a health percentage, a risk level (for example low, medium, or high), and a short recommendation such as “check lubrication,” “inspect guides,” or “watch retries during operation.” This gives maintenance and production teams a quick visual overview of which parts of the line are working normally and which ones are starting to behave differently and may need attention soon.
Anomalies, Precursors and Time‑to‑Failure Models
Detecting anomalies in everyday motion
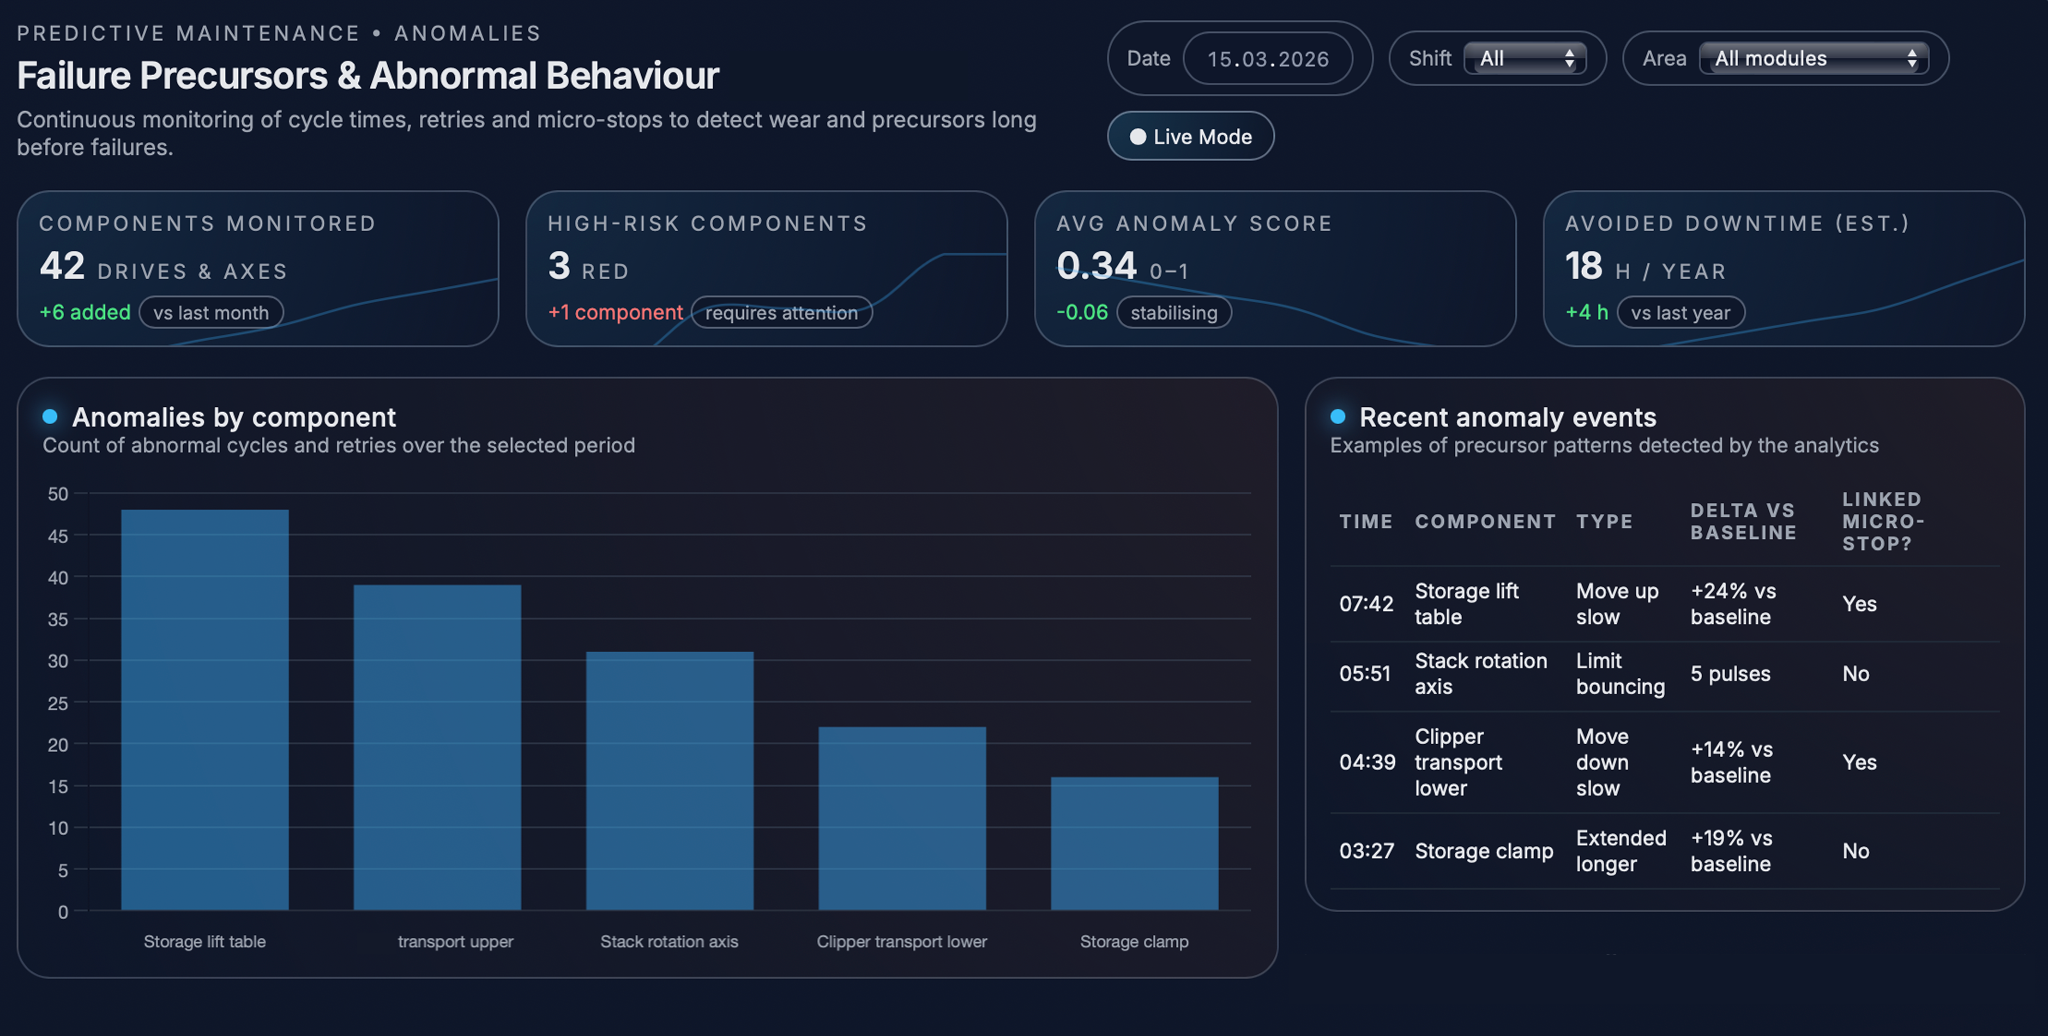
Once basic health indicators are in place, the system looks for clear signs that a drive or motion axis is starting to behave differently from normal. For each component it first learns a baseline: typical cycle times, usual number of retries, and normal motion sequences for different products and speeds. Around this baseline it sets simple thresholds, for example “up to 10–15% slower than usual is still acceptable.” Every new movement is then compared to this baseline; if a cycle is much slower or the sequence of signals is unusual, it is marked as an anomaly. The more often this happens, and the stronger the deviations, the higher the anomaly score for that component becomes, making it stand out in the analytics.
Failure precursors that appear
before breakdowns
When the same anomalies appear again and again, the system treats them as early warning signs. These patterns, called precursors, often show up days or even weeks before an actual failure. Examples can include a lift table that needs several attempts to reach its position, a transport axis that becomes slowly slower over time, or a unit that repeatedly shows temperature or protection warnings during the same shift.
Each precursor is linked to a specific component and clearly shown in the interface. This allows the team to see not only that something is wrong, but also where the problem appears and how it affects the movement.
In the “Failure Precursors & Abnormal Behaviour” view, these events are grouped by component and by time. This makes it easy for engineers to see which parts of the line produce the most warnings and what kind of unusual behaviour is happening, so they can decide what should be checked first.
Estimating remaining useful life
When enough history is available, the system can go a step further and estimate how long a component is likely to keep working before the risk of failure becomes high. After every breakdown or major repair, the system looks back at the previous weeks and checks how the health indicators and anomaly scores changed before the problem happened. It then compares these patterns with periods where the equipment worked normally.
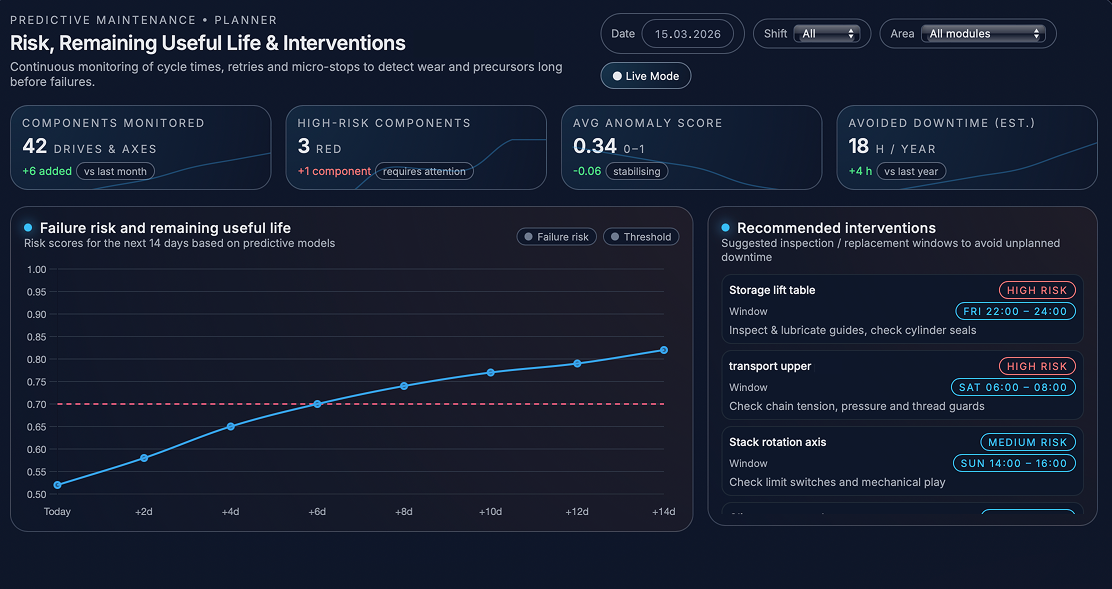
Over time, the system learns typical patterns that often appear before a failure. Using this knowledge, it can estimate how close a component may be to a critical condition. For example, it may show that a lift table has a high risk of failure in the next weeks, or that a transport axis can probably run for many more hours before maintenance becomes necessary.
These estimates are not exact predictions, but they give maintenance teams a useful time window for planning. This makes it easier to decide which components should be checked first and which ones can continue running safely, helping to avoid unexpected stops and urgent repairs.
Maintenance Planner, Alerts and Workflows
Planning work based on risk
The maintenance planner, alerts, and workflows are the part where predictive analytics becomes useful in everyday work. In the planner view, each important drive or motion axis is shown together with a simple risk trend for the next days, based on recent behaviour and the estimated remaining lifetime. Instead of looking at many technical values, planners can quickly see which components have low, medium, or high risk, and when that risk may become critical.
For components with higher risk, the system suggests suitable time windows for inspection or repair, for example during planned cleaning stops or scheduled maintenance periods. This makes it easier to coordinate maintenance with the production schedule and helps avoid unexpected failures during busy production time.
As a result, the team can prepare work in advance, reduce emergency repairs, and keep the production line running in a more stable and predictable way.
Alerts and recommended actions for the shopfloor
Alerts turn the predictions into clear messages that operators and maintenance teams can use in their daily work. The system continuously checks whether a component’s health score, cycle time, or estimated failure risk goes beyond the allowed limits. When this happens, it creates a clear message in plain language, for example that a certain axis is getting slower or repeating movements more often and should be checked.
Different alert levels can be used depending on how serious the situation is. Small deviations may only appear in the dashboard, while stronger warnings can create on-screen notifications, emails, or maintenance tickets.
Engineers can adjust the settings so the system fits the needs of the plant. They can choose how far ahead the system should predict, what should be considered a high risk, and which signals should be used in the analysis. This makes it possible to balance early warnings with the need to avoid too many unnecessary alerts.
Learning from every maintenance intervention
An important part of the process happens after maintenance work is completed. When technicians inspect or repair a drive — for example lubricating guides, adjusting tension, or replacing a sensor — they record the action in the system together with the component that was serviced. The system then treats this moment as a reset point and starts watching how the behaviour changes after the repair.
Normally, after maintenance, movements should become faster again, retries should decrease, and warning events should appear less often. If this improvement is visible, the system updates its understanding of what normal behaviour looks like for that component, and future risk estimates become more accurate. If the problem continues, the system keeps showing warnings, which may mean that the real cause has not been fully fixed.
Over time, this feedback creates a history of how each drive or motion axis behaves before and after different types of maintenance. The system also learns which limits work well and which ones need adjustment, and which recommendations actually help to prevent failures.
Because of this, the planner and alert system does not only warn about problems, but also improves from experience. Predictive maintenance becomes part of everyday work, helping the team keep the production line stable and reducing unexpected downtime.
Conclusions
Impact on day‑to‑day production
The predictive maintenance system for drives and motion axes has already changed how the production line behaves in everyday work. By continuously tracking cycle times, repeated movements, and warning signals, the system helps detect problems early so that mechanical units can be checked and repaired before they fail. As a result, unexpected breakdowns happen less often, emergency repairs take less time, and overall line availability becomes more stable. Production teams see fewer sudden interruptions during important orders, and maintenance can focus on the components that really need attention instead of checking everything on the same schedule.
This use case also changes the way maintenance is planned. Instead of following a fixed calendar, where every drive is checked after a certain number of months, decisions can be based on the real condition of each component. Parts that show no warning signs can stay in operation longer, while components with higher risk can be inspected or replaced during the next planned stop. Over time, this condition-based approach reduces unnecessary work, uses spare parts more efficiently, and makes cooperation between production and maintenance easier because decisions are based on clear data rather than assumptions.
The same approach can be extended further. If needed, additional sensors such as vibration, current, or temperature monitoring can be added to the most critical drives to detect wear even earlier. The models used for drives, transports, lift tables, and positioning units can also be applied to other equipment on the line and later to other lines in the plant. Step by step, this builds a wider predictive maintenance system that covers more of the factory. With more data and more experience, the predictions become more accurate, helping the plant move toward a situation where most maintenance is planned in advance, unexpected failures are rare, and the production line runs smoothly in the background.


Our success stories


.avif)


Tell us about your project needs


.png)
.png)