


The table of content
Introduction
The purpose of this use case is to put clear numbers and rules around something that operators and quality teams often judge only from experience: how material thickness and cutting quality influence scrap, rework, and customer complaints. Instead of looking only at defects at the end of the process, the solution combines thickness measurements, cutting data, and detection signals into one view that shows how stable the process really is and where problems begin. The goal is to detect issues as early as possible so that defective material can be corrected, downgraded, or removed before it turns into expensive scrap later in production or causes problems for the customer.
Thickness and cutting quality are critical because they directly affect how well the material holds together during pressing, handling, and final use. If the material is too thin in some areas, if thickness varies too much across the width, or if edges are damaged or not cut cleanly, the final product becomes weaker and defects are more likely to appear. This is especially important when material from different zones or batches is combined, because a weak area in one part can affect the quality of the whole panel. By linking thickness profiles and cutting events with real production results such as OK, rework, or scrap, the system makes these hidden connections visible and helps engineers understand what needs to be improved.
The main goals of the use case are to detect thickness and cutting problems early, learn which patterns lead to defects, and turn this knowledge into practical rules for production. These rules can include recommended thickness ranges, limits for allowed variation, and clear guidelines for process settings.
The system is mainly used by quality engineers, process engineers, and production supervisors who need a shared and objective view of where quality losses happen and how the process should be adjusted. Operators also benefit, because dashboards and alerts give simple messages such as increasing variation in one zone or worsening edge quality, helping them understand why settings need to be changed or why additional checks are required.
Data Used
Thickness measurement sensors
and moisture‑related information
The solution uses thickness sensors that are already installed on the production line, usually arranged as several measurement points across the width of the material. These sensors provide continuous or sampled thickness values while the material passes through the process, making it possible to see how thickness changes at the edges, in the centre, and in other important zones.
For each material type and grade, the system uses nominal thickness values and allowed tolerance ranges taken from existing recipes or quality standards. When available, additional information such as moisture level from drying or moisture sensors is also included.
By combining these signals, the system can evaluate the measurements in the correct context. Instead of only showing that the material is too thin or too thick, it can determine whether the thickness in a specific zone is outside the safe range for the current material and production conditions.
Cutting and composition signals
(cutoff, composition shear, miscuts)
Cutting-related signals show how accurately the material is being cut and assembled during the process. Sensors at cutting stations record when each cut happens, how long the cutting cycle takes, and whether the cycles run normally or show irregular behaviour, such as repeated cuts, missed cuts, or interrupted cycles. Signals from the joining or assembling step provide similar information, including when each cycle starts and ends and how well the timing matches the movement of the material. When these signals are analysed together with thickness measurements, the system can detect patterns that are not visible from a single signal. For example, it can show that cutting errors appear more often when the material is thinner in certain zones, or when the cycle timing slowly moves away from its normal range.
Workpiece detection, edge quality
and thread‑guard signals
Workpiece detection sensors placed before and after cutting and gluing show whether the material is present, correctly positioned, or missing at important points in the process. These signals help confirm that the material moves through the line as expected. Additional sensors that check edges or surface appearance give an indication of edge quality. They can detect when edges are not clean, for example if they are damaged, uneven, or not aligned properly. Protection sensors also help detect loose material, overlaps, or other irregularities that may disturb cutting or cause local defects later in the process. By combining these signals with thickness and cutting data, the system can better understand the real reason for quality problems. It can separate issues caused by incorrect thickness from problems related to cutting quality, alignment, or material condition at the edges.
Quality outcomes, defect codes
and production/material context
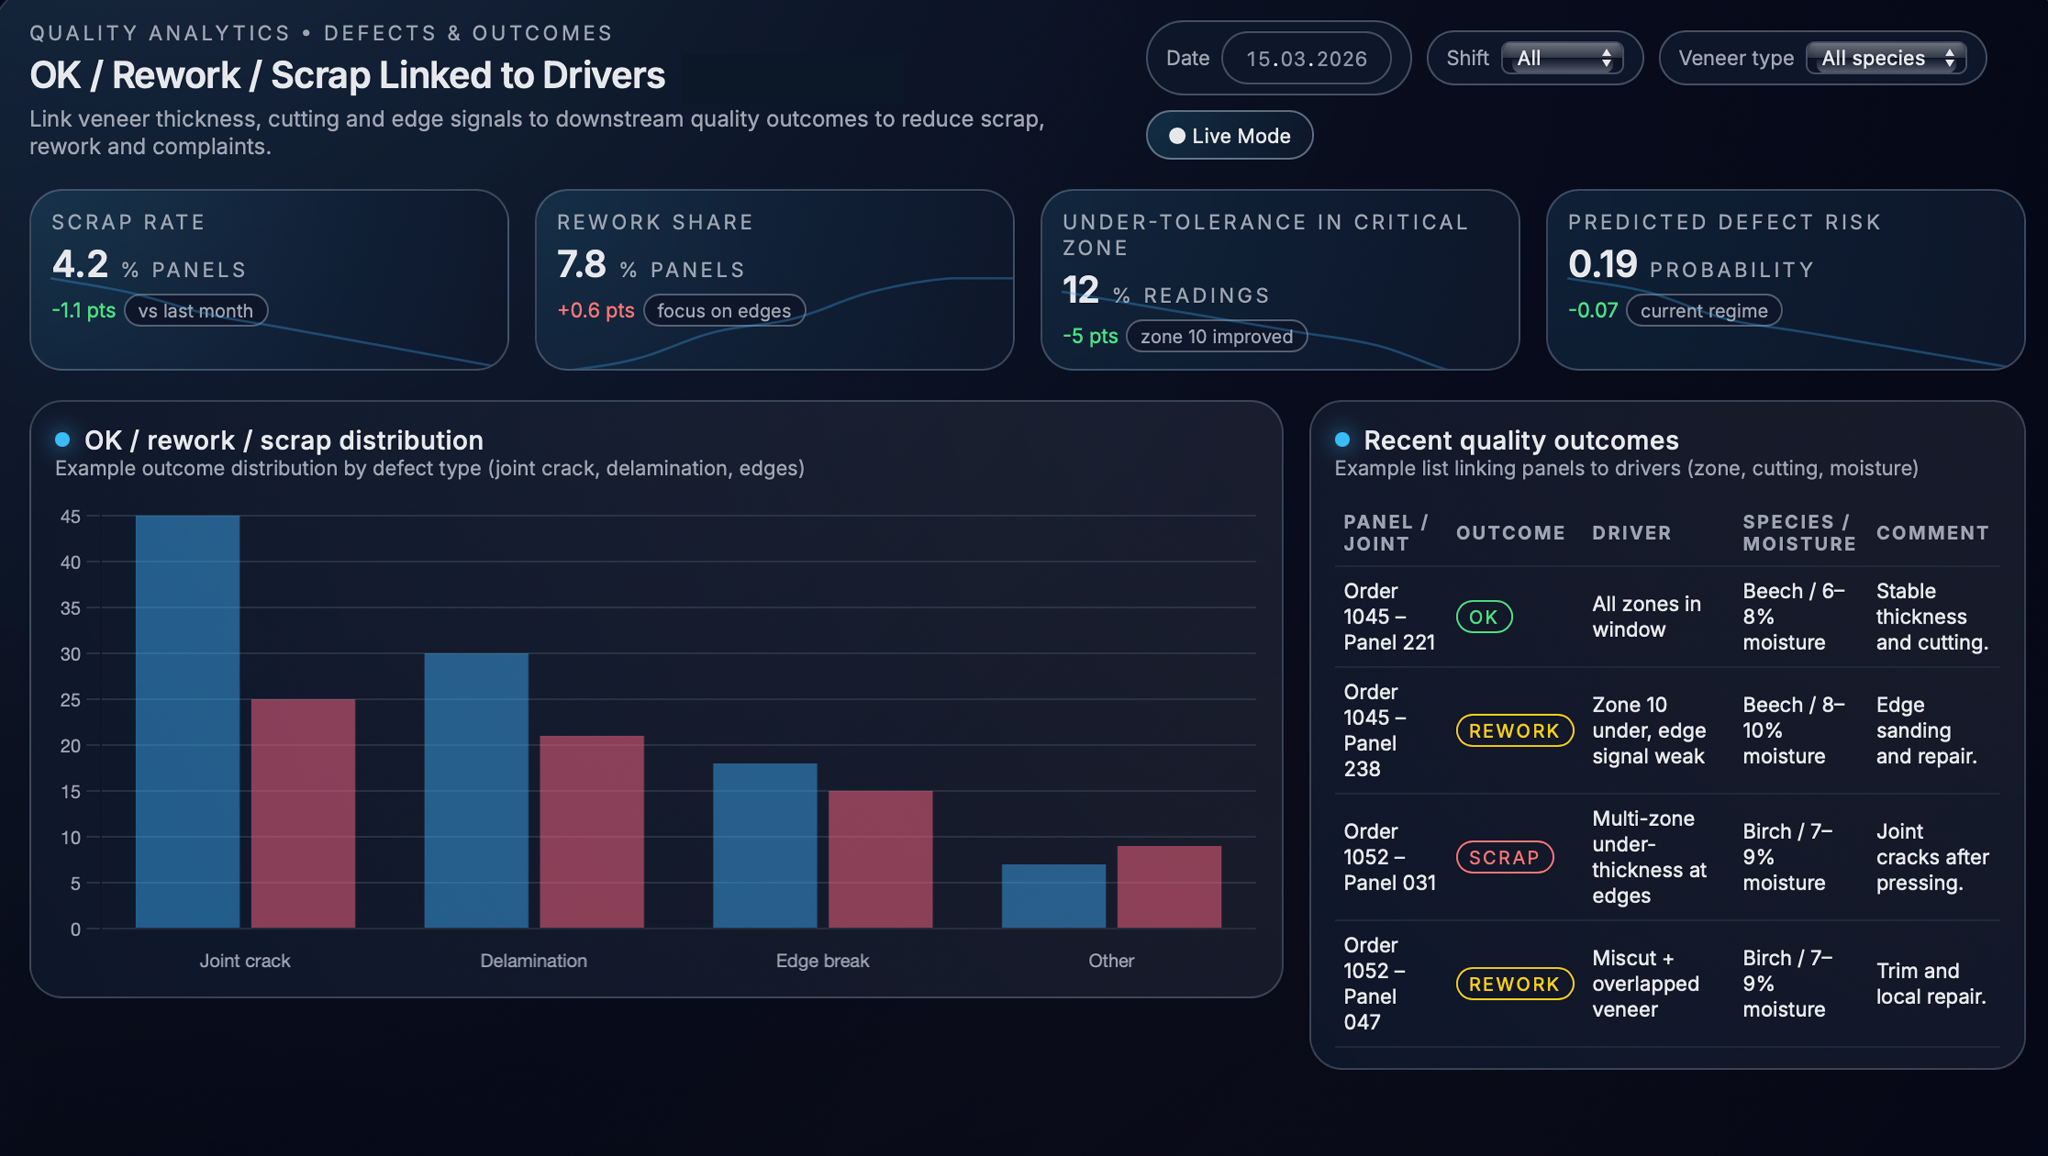
Finally, all process data is connected with the actual production results. For each panel or joint, the system records whether the result was OK, required rework, or became scrap, together with the defect type that was reported, such as cracks, delamination, thickness out of tolerance, or edge damage. Additional context is also stored, including material type and grade, moisture range, product type, process settings, shift, production speed, and other important parameters. This makes it possible to compare similar production conditions instead of mixing different situations together. By combining detailed process signals with clear quality results, the system can learn which thickness patterns, cutting behaviour, or process changes really affect quality and which differences are normal and do not cause problems. This helps engineers focus on the factors that truly matter and avoid unnecessary adjustments when the process is still within a safe range.
Technical Realisation
Deriving thickness profiles and
tolerance checks per sheet and zone
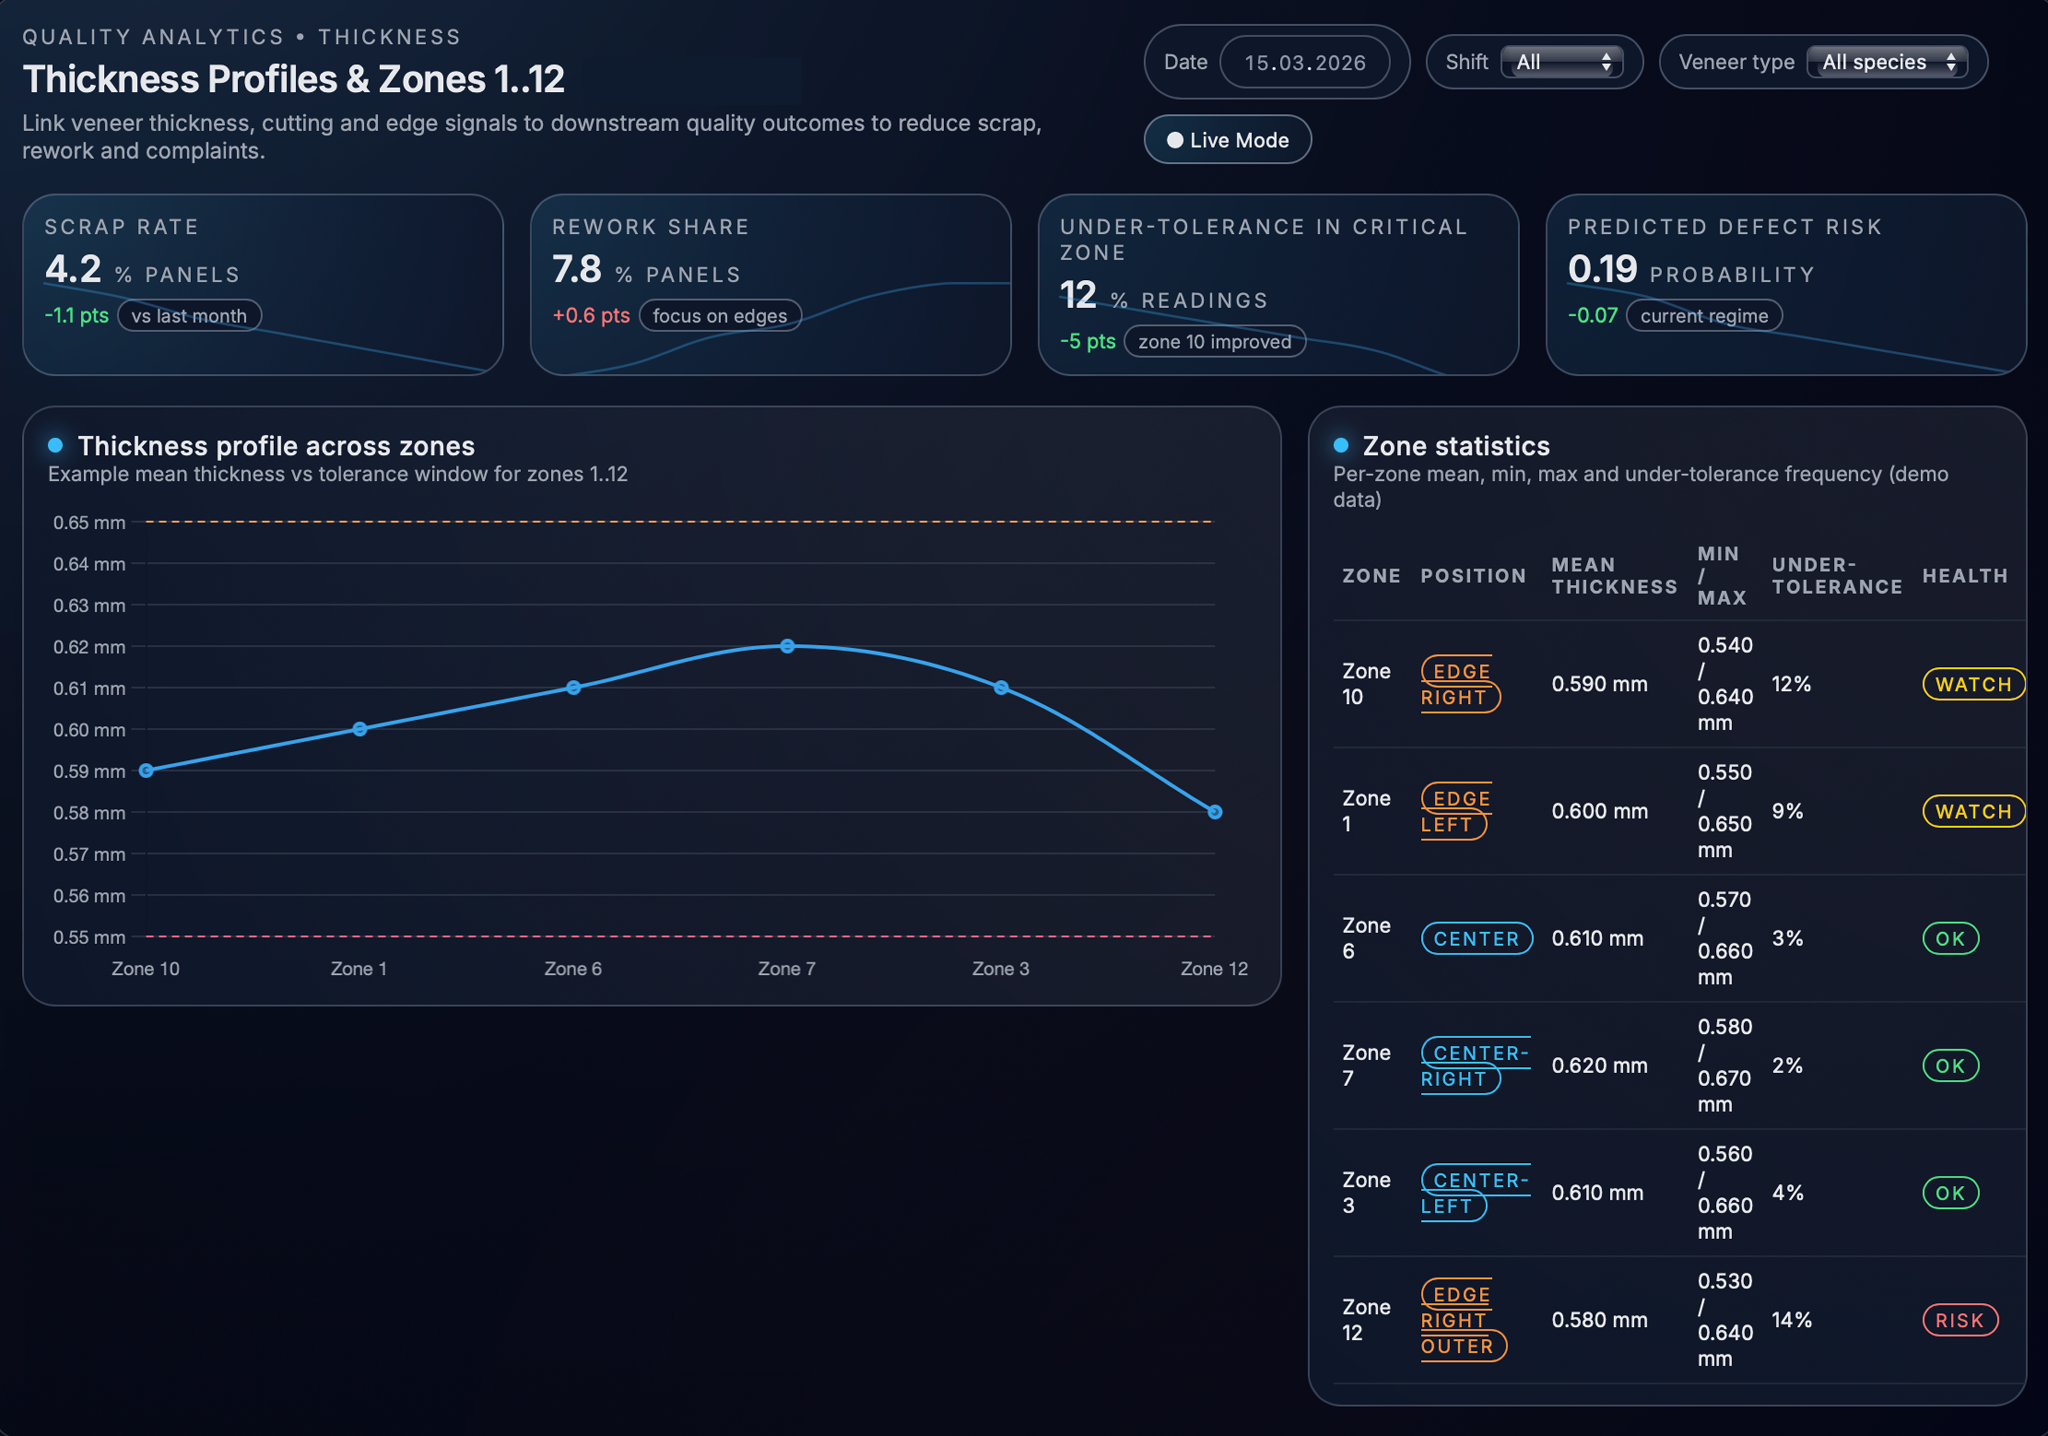
From the raw sensor data, the system rebuilds the thickness profile of each sheet across all measurement zones. For every pass, it calculates simple but useful values such as the average thickness, minimum and maximum values, variation across the width, and how often the measurements go outside the allowed tolerance range for the current material and moisture level. This makes it possible to describe the situation much more clearly. For example, the system can show that one edge zone is below tolerance many times during the shift, or that the edges are consistently thinner than the centre. Such information is much more useful than a single average value, because it shows exactly where the problem appears and how often it happens. With this level of detail, engineers and operators can react earlier and adjust the process before the deviation leads to defects or scrap.
Cut‑quality and edge‑quality indicators
from cycle and sensor data
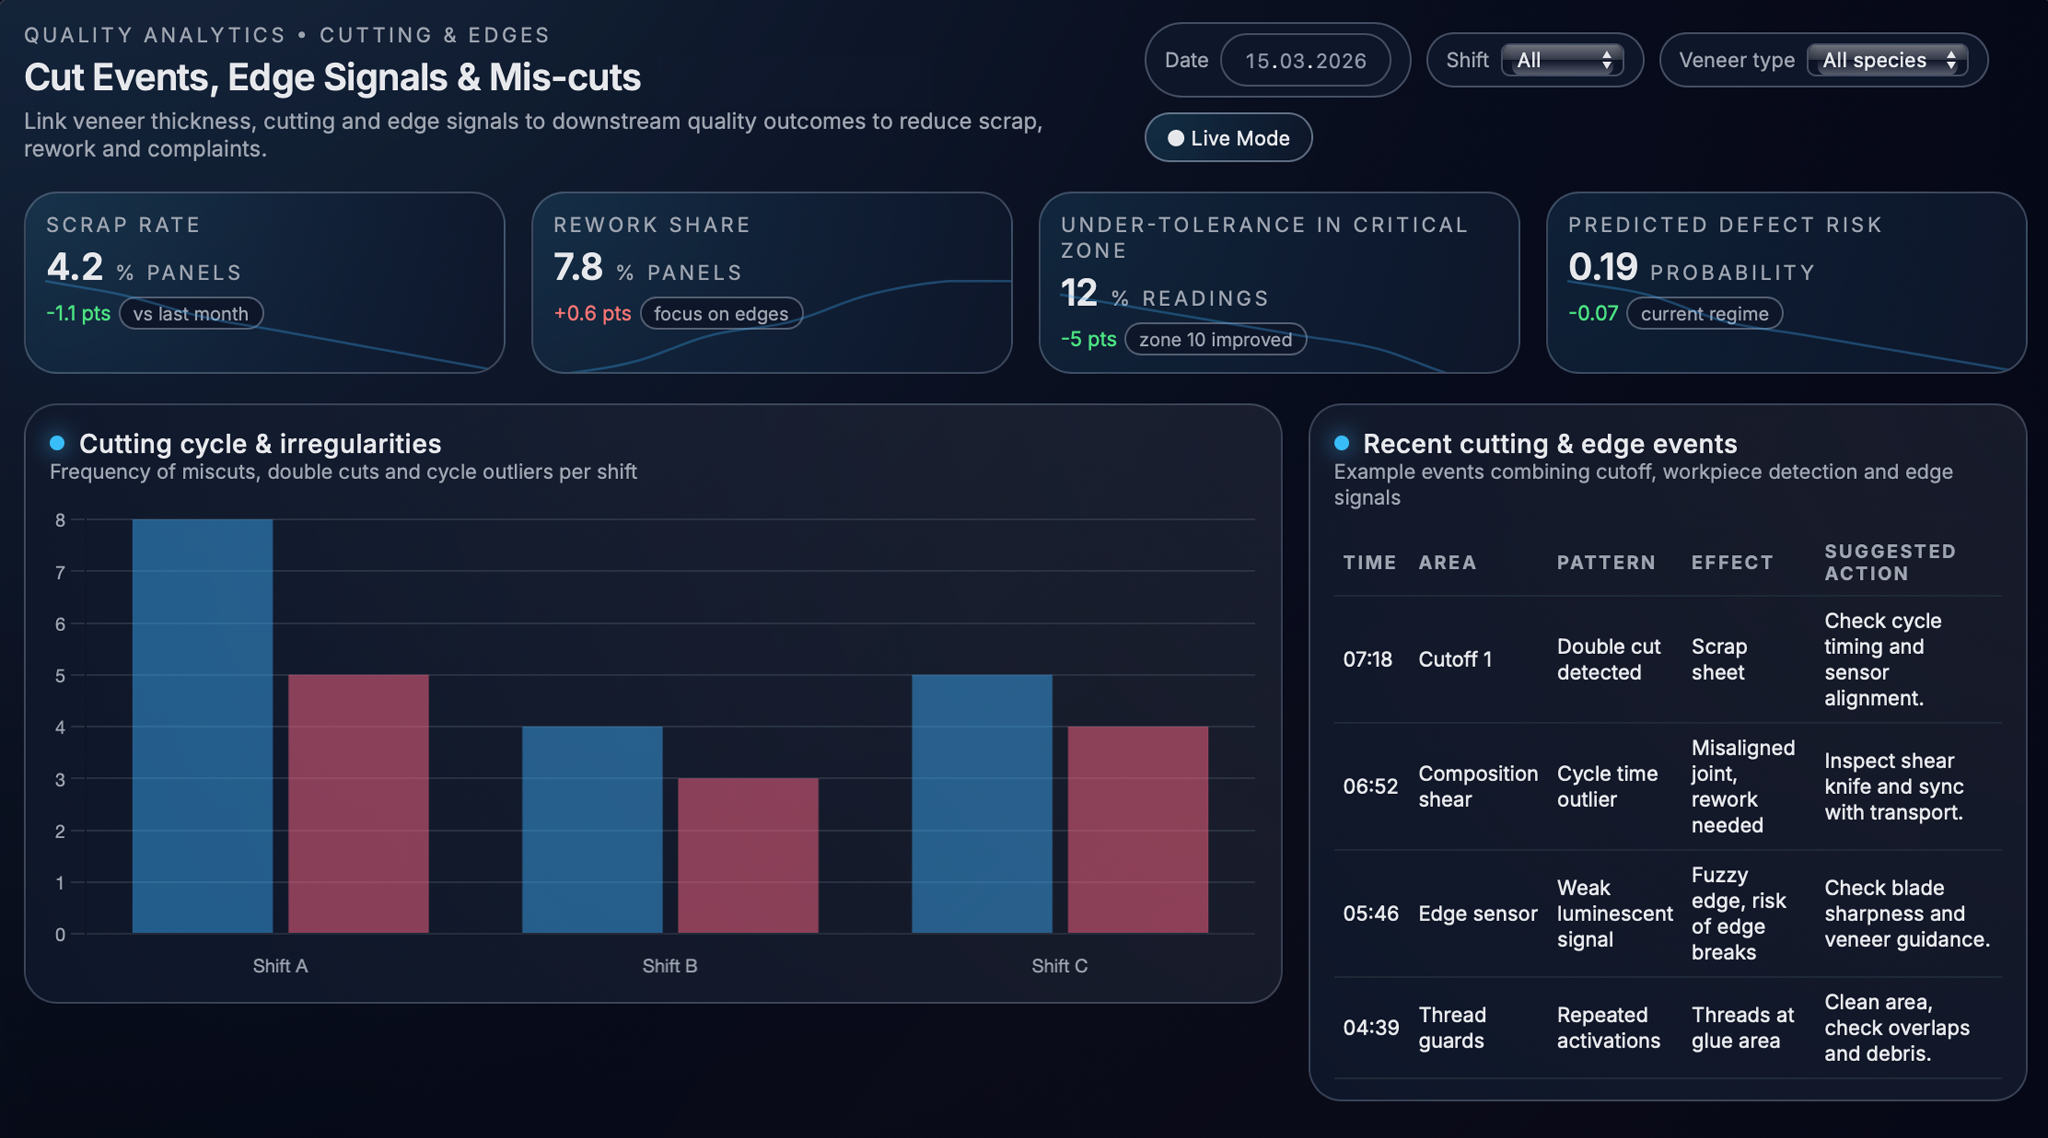
At the same time, the system analyses cutting cycles and signals related to edge quality. It measures how long each cutting cycle takes, checks whether the cycles run regularly, and detects unusual situations such as repeated cuts, missed cuts, or interrupted cycles. The timing of these cycles is compared with workpiece detection signals to find cases where a cut happened without material or when material passed without a confirmed cut. Signals that indicate edge condition are also evaluated. These may show weak edge detection, repeated protection triggers, or possible overlaps of material. Instead of showing raw sensor values, the system converts them into simple flags that can be compared between shifts, products, or time periods. By combining these indicators, the system gives a clear picture of how stable and clean the cutting and edge formation really are, without relying only on manual checks or visual inspection.
Linking process signals to OK / rework / scrap outcomes with models
The next step is to connect thickness and cutting indicators with the final production result. For each finished piece, the system looks back at the thickness profile, cutting cycles, and edge signals that were recorded while the material was processed. These values are combined with additional information such as material type, moisture level, product type, and main process settings. Using this data, the system learns which conditions usually lead to good results and which ones often end with rework or scrap. It builds models that can estimate the risk of defects based on the current process signals. After the models are trained, they can analyse new production almost in real time. When the current signals look similar to situations that caused problems in the past, the system highlights the risk and shows which panels, zones, or process conditions may lead to defects. This allows the team to react earlier, instead of waiting until the problem appears at the end of the process.
Discovering patterns that drive joint cracks, delamination and edge breaks
Because the goal is to help engineers make decisions, not just show numbers, the system also explains why a higher defect risk appears. Instead of only giving a score, it looks at which signals had the biggest influence on the result. By analysing past production data, the system can find patterns such as certain zones being below tolerance more often, large thickness variation across the width, or unstable cutting and edge signals that frequently appear before defects. It can also detect combinations of conditions that are known to cause problems, for example when thickness variation together with certain moisture ranges leads to weaker product quality, or when poor edge signals and repeated protection triggers are followed by edge damage later in the process. These patterns are shown in the dashboards as simple rules and examples, not as complex model data. This makes it easier for quality and process engineers to understand which factors have the strongest effect on the result and where adjustments should be made first. With this approach, the system does not only warn about risk, but also helps the team see what should be changed to keep the process stable and avoid defects.
User Interface, Alerts and Workflows
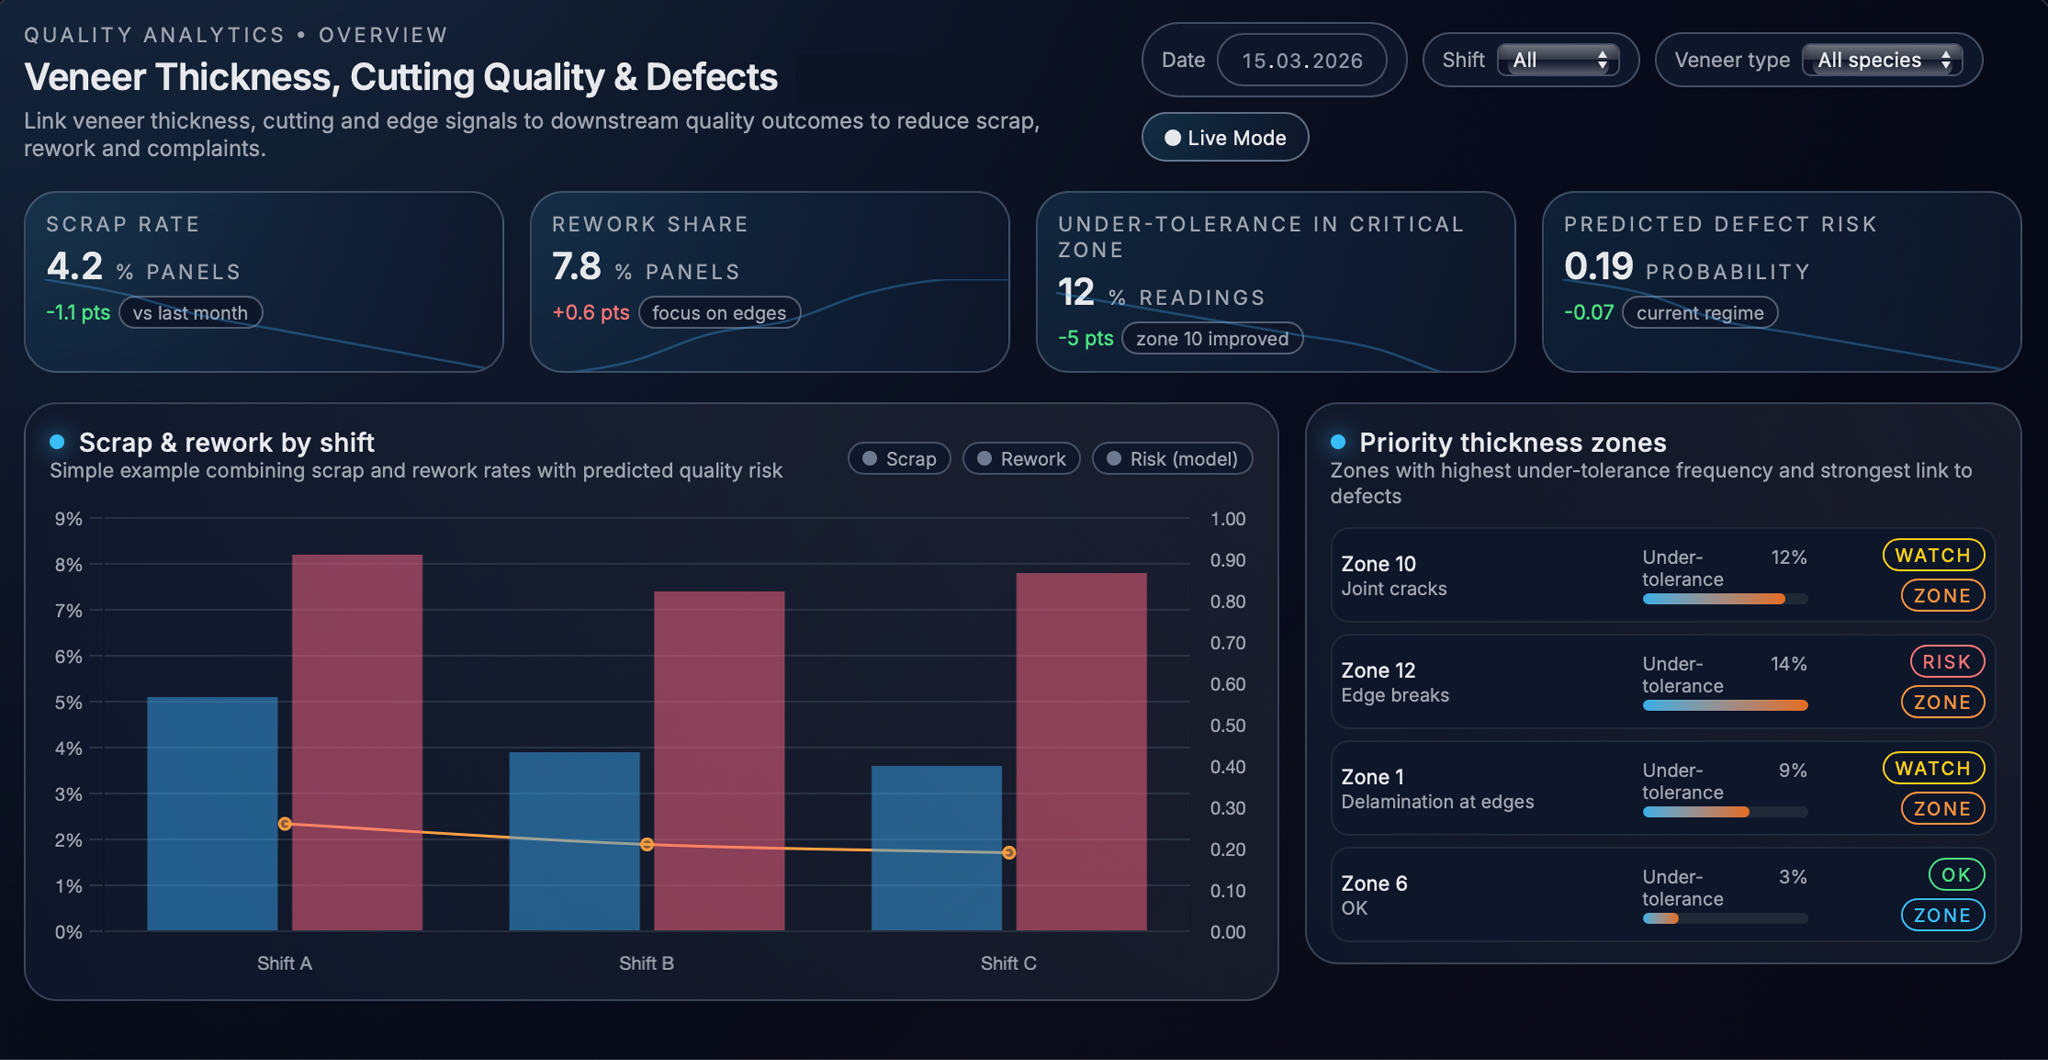
The user interface combines all data into dashboards that are easy to use in daily meetings and on the shop floor. One view shows scrap and rework by shift together with a quality-risk trend, so the team can quickly see whether recent adjustments helped. Other views focus on thickness zones and show where values go outside tolerance and how this relates to defect types, making it easier to find the real source of quality losses.
The system also provides alerts for early signs of problems. Warnings appear when thickness goes outside limits, cutting cycles become irregular, or edge-quality signals worsen. Messages are shown in plain language with suggested checks, so operators and engineers can react quickly without analysing raw data. Alerts can be displayed in dashboards, on operator screens, or sent through email or messaging tools, depending on plant preferences.
In addition, the system generates reports and recommendations for recipe updates and improvement projects. For each product, it shows recommended thickness ranges and key parameters based on real production data. Reports highlight where process drift causes higher scrap and estimate the benefit of fixing specific issues, helping engineers and managers decide what to improve first.
Business Value and Conclusions
By linking thickness, cutting, and edge-quality signals with final results, problems can be detected much earlier. Instead of finding defects at the end of the process, the plant sees warning signs in real time and can adjust settings before material is lost. This reduces scrap, limits rework, and lowers the risk of customer complaints while making production more stable.
Clear thickness ranges and process recommendations help keep production in the optimal window. Quality becomes more consistent, less dependent on operator experience, and material waste is reduced. Better control of thickness improves yield and makes more efficient use of raw material.
This use case also creates a foundation for predictive quality analytics across the production line. The same data and models can be extended to other equipment, sensors, and process steps. Over time, this allows the plant to move from reacting to defects toward predicting and preventing them, leading to more stable quality and fewer interruptions.


Our success stories


.avif)


Tell us about your project needs


.png)
.png)