


The table of content
Introduction
Why near‑miss analytics matters
On many production lines, safety performance is still managed through headline accident rates, lost‑time incident statistics, and occasional incident reports, even though the real warning signs appear much earlier in the form of near‑misses and frequent safety‑device activations. These events are often logged only as raw PLC bits or brief “safety stop” entries, without context or follow‑up, so they disappear into day‑to‑day noise: repeated manual unlocks to clear a jam, light‑barrier trips during awkward stack changes, or emergency stops hit “just to be safe.” As a result, management may see stable lagging indicators while underlying exposure grows, unsafe workarounds become normalised, and safety‑related micro‑stops quietly eat into productive time.
Infinity Technologies operates precisely in this environment, at the intersection of industrial safety and production data, and has seen how often these “ignored” safety activations are the missing link between incident investigations and daily operations. To address this gap, the company has developed the Safety & Near‑Miss Analytics use case, which continuously collects safety‑related PLC signals, treats every interlock unlock, emergency stop, light‑barrier trip and manual unlock as a near‑miss data point, and enriches each event with operational context. Instead of a vague sense that “we have some safety stops on the night shift,” plants gain a structured, near‑real‑time view of where and when near‑misses occur, what patterns repeat, and which areas carry the highest potential severity. This becomes a practical foundation for targeted training, guarding and layout improvements, and governance‑ready safety reports, rather than reactive responses to the next major incident.
Data Used
Safety signals, context and event sequences
The Safety & Near‑Miss Analytics use case relies on a structured combination of safety signals and operational context so that every activation becomes a meaningful near‑miss record instead of a raw log line. Rather than keeping safety information buried in PLC bits or free‑text downtime comments, the solution builds a consistent dataset that can be searched, trended and compared across areas, shifts and time periods. This dataset is the backbone for all later steps: scenario detection, anomaly scoring, reporting and follow‑up.
Safety‑related PLC and event signals capture when interlocks, emergency stops, light barriers and protective‑fence buttons are activated or reset, along with any guard‑locking or safety‑gate status that is available. Each change of state is stored with a precise timestamp, device identifier and location, so it is always clear which guard, rope, button or barrier triggered a stop, unlock or reset. This transforms previously opaque “safety stop” entries into detailed traces of how operators interact with guarding and emergency devices in real operating conditions.
Operational context is attached to every safety signal to explain under which conditions it occurred. Typical context fields include machine mode (manual, automatic, setup), the active product or order, the current shift (for example, day or night), the running state of the line, and classifications for downtime and micro‑stops. With this enrichment, the system can separate expected behaviour, such as frequent unlocks during setup or maintenance windows, from more concerning patterns like repeated manual unlocks in automatic mode or spikes in emergency stops on a specific product family. Over time, this context also makes it possible to see how changes in products, staffing or layout influence safety behaviour.
Each enriched safety activation is then linked into a reconstructed event sequence that captures what happened shortly before and after the trigger. For a given emergency stop or light‑barrier trip, the system rebuilds the preceding seconds or minutes of mode changes, motion commands and other safety‑device signals, turning isolated events into short narratives such as “automatic mode → stack movement → light barrier ‘stack not in position’ → fence stop → emergency stop.” These sequences become the core near‑miss records used later for clustering into recurring scenarios, detecting anomalies and generating trend and hotspot summaries. Because every record shares the same structure, engineers and HSE specialists can filter for specific combinations (for example, “unlock during automatic mode on night shift”) and compare scenarios across lines or plants, using the same dataset as the basis for both quantitative analysis and qualitative investigations.
Technical Realisation
Sequence analysis, anomalies and LLM reports
The Safety & Near‑Miss Analytics engine turns raw safety events into structured scenarios, anomalies and human‑readable reports that can drive concrete actions. It builds on the enriched event data to understand not just that a safety device was triggered, but what typically happens before, during and after these activations.
First, sequence analysis reconstructs typical event chains around safety activations to identify near‑miss scenarios. For each emergency stop, guard unlock, light‑barrier trip or fence‑button stop, the system looks back over a configurable time window of preceding signals (mode changes, motion commands, interlocks and other safety devices) and assembles a short sequence such as “automatic mode → stack movement → light‑barrier ‘stack not in position’ → fence stop → emergency stop.” Similar sequences are grouped using pattern‑mining and clustering methods, revealing recurring near‑miss types like “manual unlock during automatic mode” or “barrier trips during stack change,” each tagged with frequency, typical areas, shifts and products so they can be prioritised by how often and where they occur.
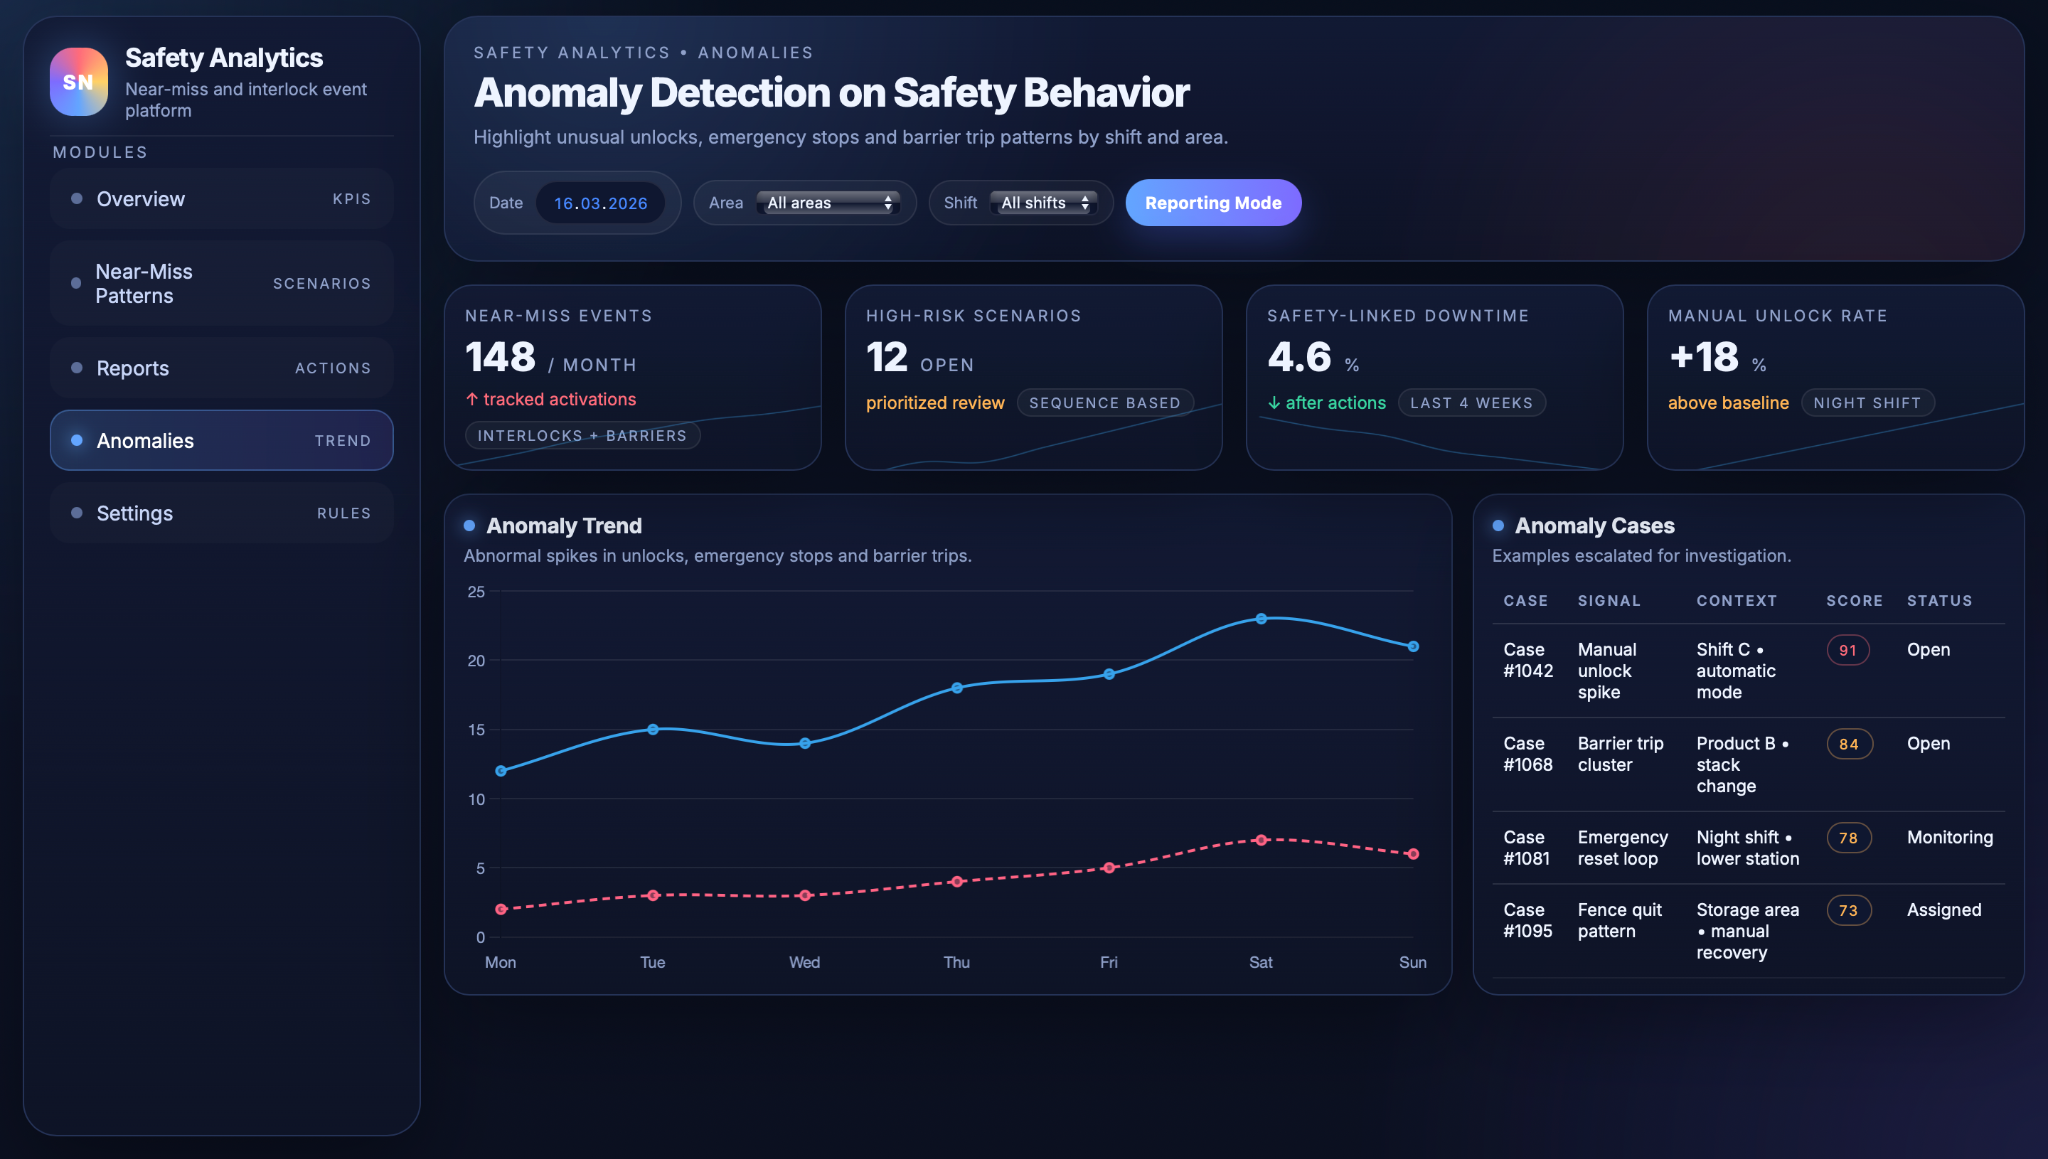
Second, anomaly detection monitors safety behaviour over time to highlight unusual spikes or combinations that deviate from established baselines. The system learns normal rates of guard unlocks, fence stops and emergency stops per area, shift, product and operating mode, taking into account that some tasks, such as changeovers, naturally involve more manual interventions. It then assigns anomaly scores when current behaviour departs significantly from this baseline – for example, a sudden rise in emergency stops in one zone or an unusually high count of fence unlocks while in automatic mode – and surfaces these periods for review, with each case including the signal type, context, risk score and follow‑up status.
Third, an integrated large language model turns the analysed data into safety reports and recommendations that are easy to use in meetings and investigations. Aggregated statistics (counts and rates by device, area and shift), near‑miss scenarios and anomaly cases are passed to the model as structured input; it generates periodic summaries that explain key trends, highlight hotspots and describe the main scenarios in plain language. The same reports propose preventive actions such as focused training, layout or guarding changes, or interlock‑logic adjustments, and they are formatted to support toolbox talks, safety‑committee reviews and root‑cause analyses with clear sections on “what happened,” “why it matters” and “recommended next steps.”
Dashboards and Workflows
KPI, scenarios, actions and settings
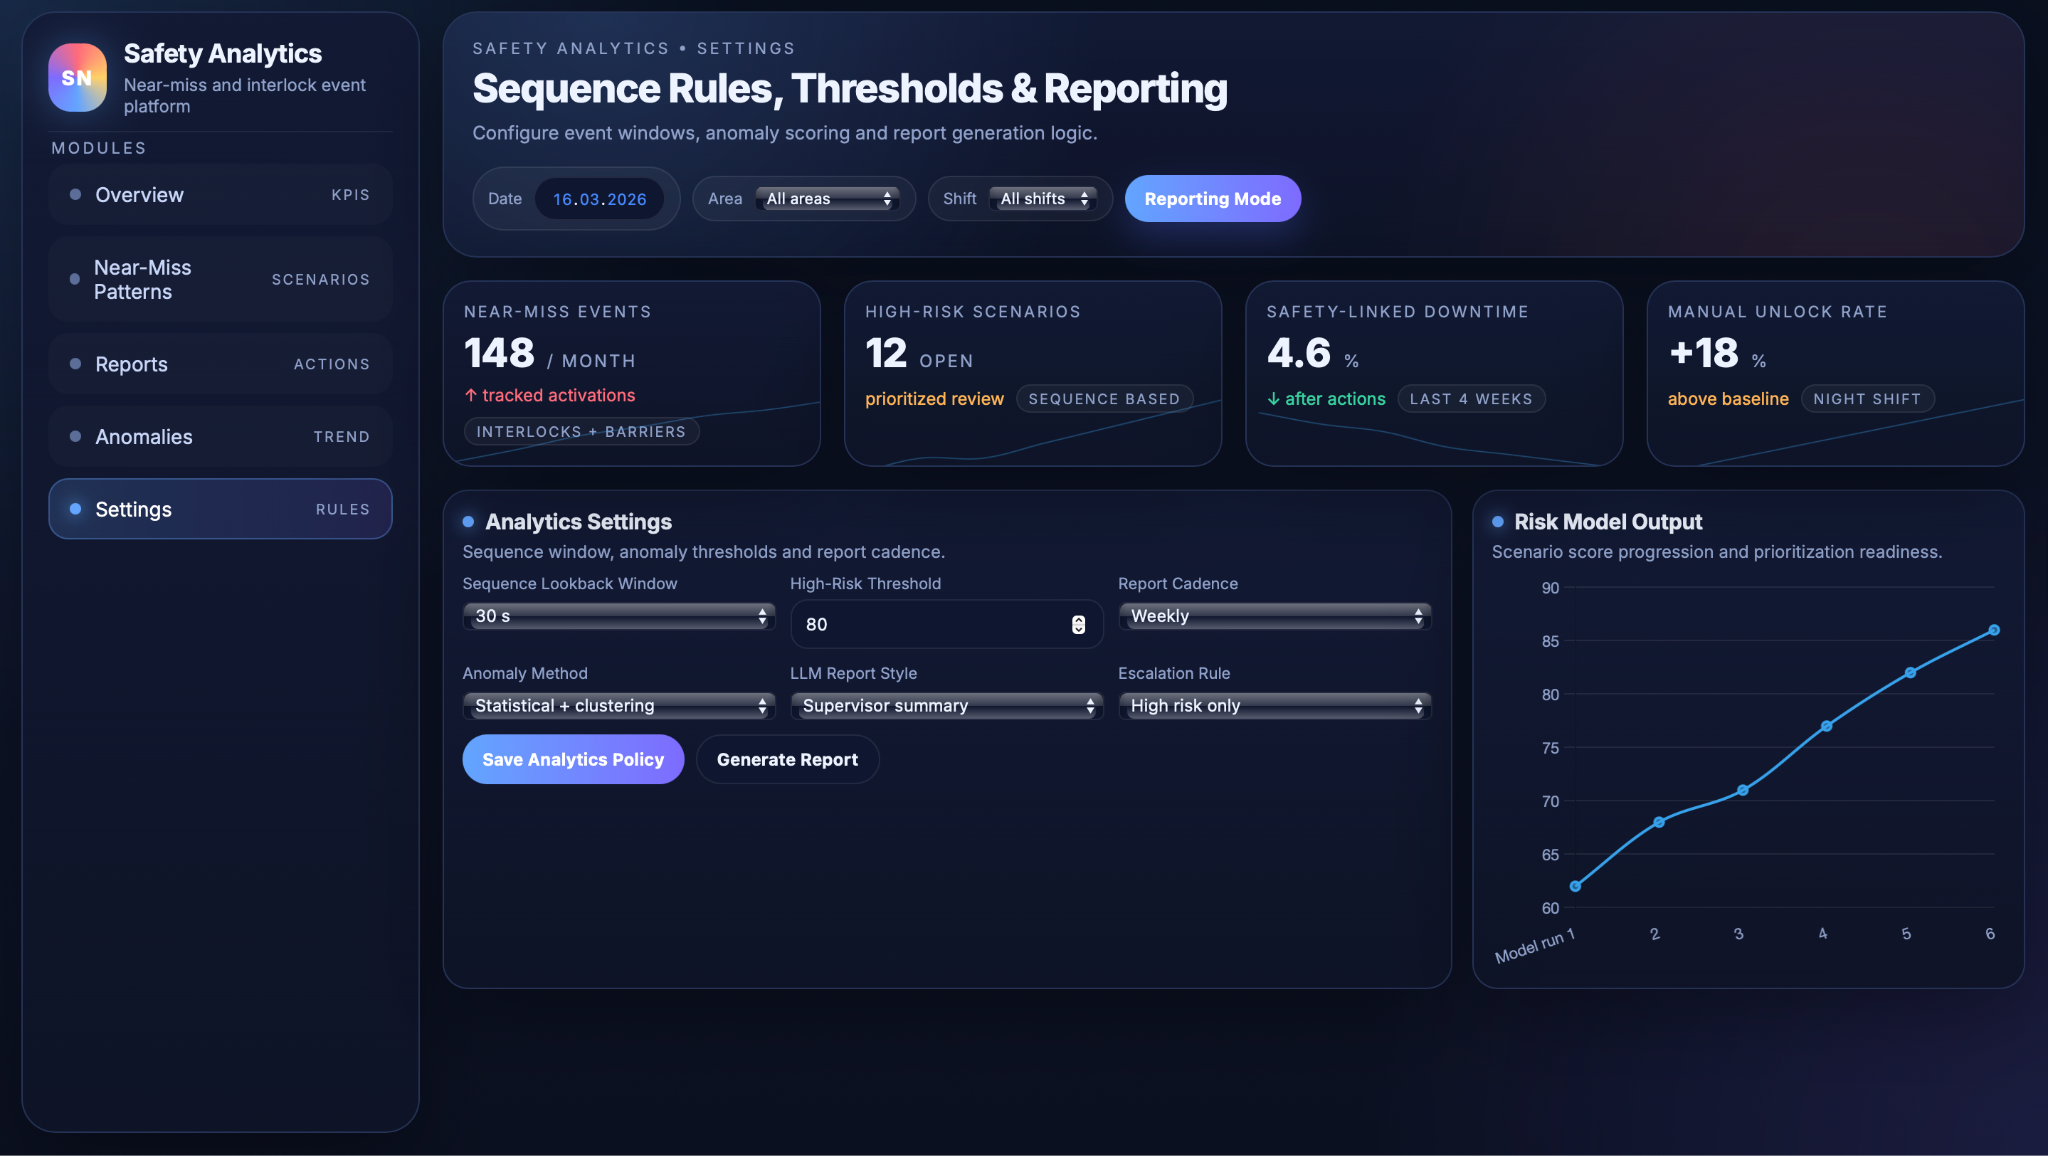
The Safety & Near‑Miss Analytics interface is organised so that users can move from high‑level indicators to concrete actions and, when needed, to the configuration rules behind the analytics. Each view supports a different step of the “see risk → understand → act → verify” loop, so that near‑miss insights do not stay in dashboards but feed into real changes on the shop floor.
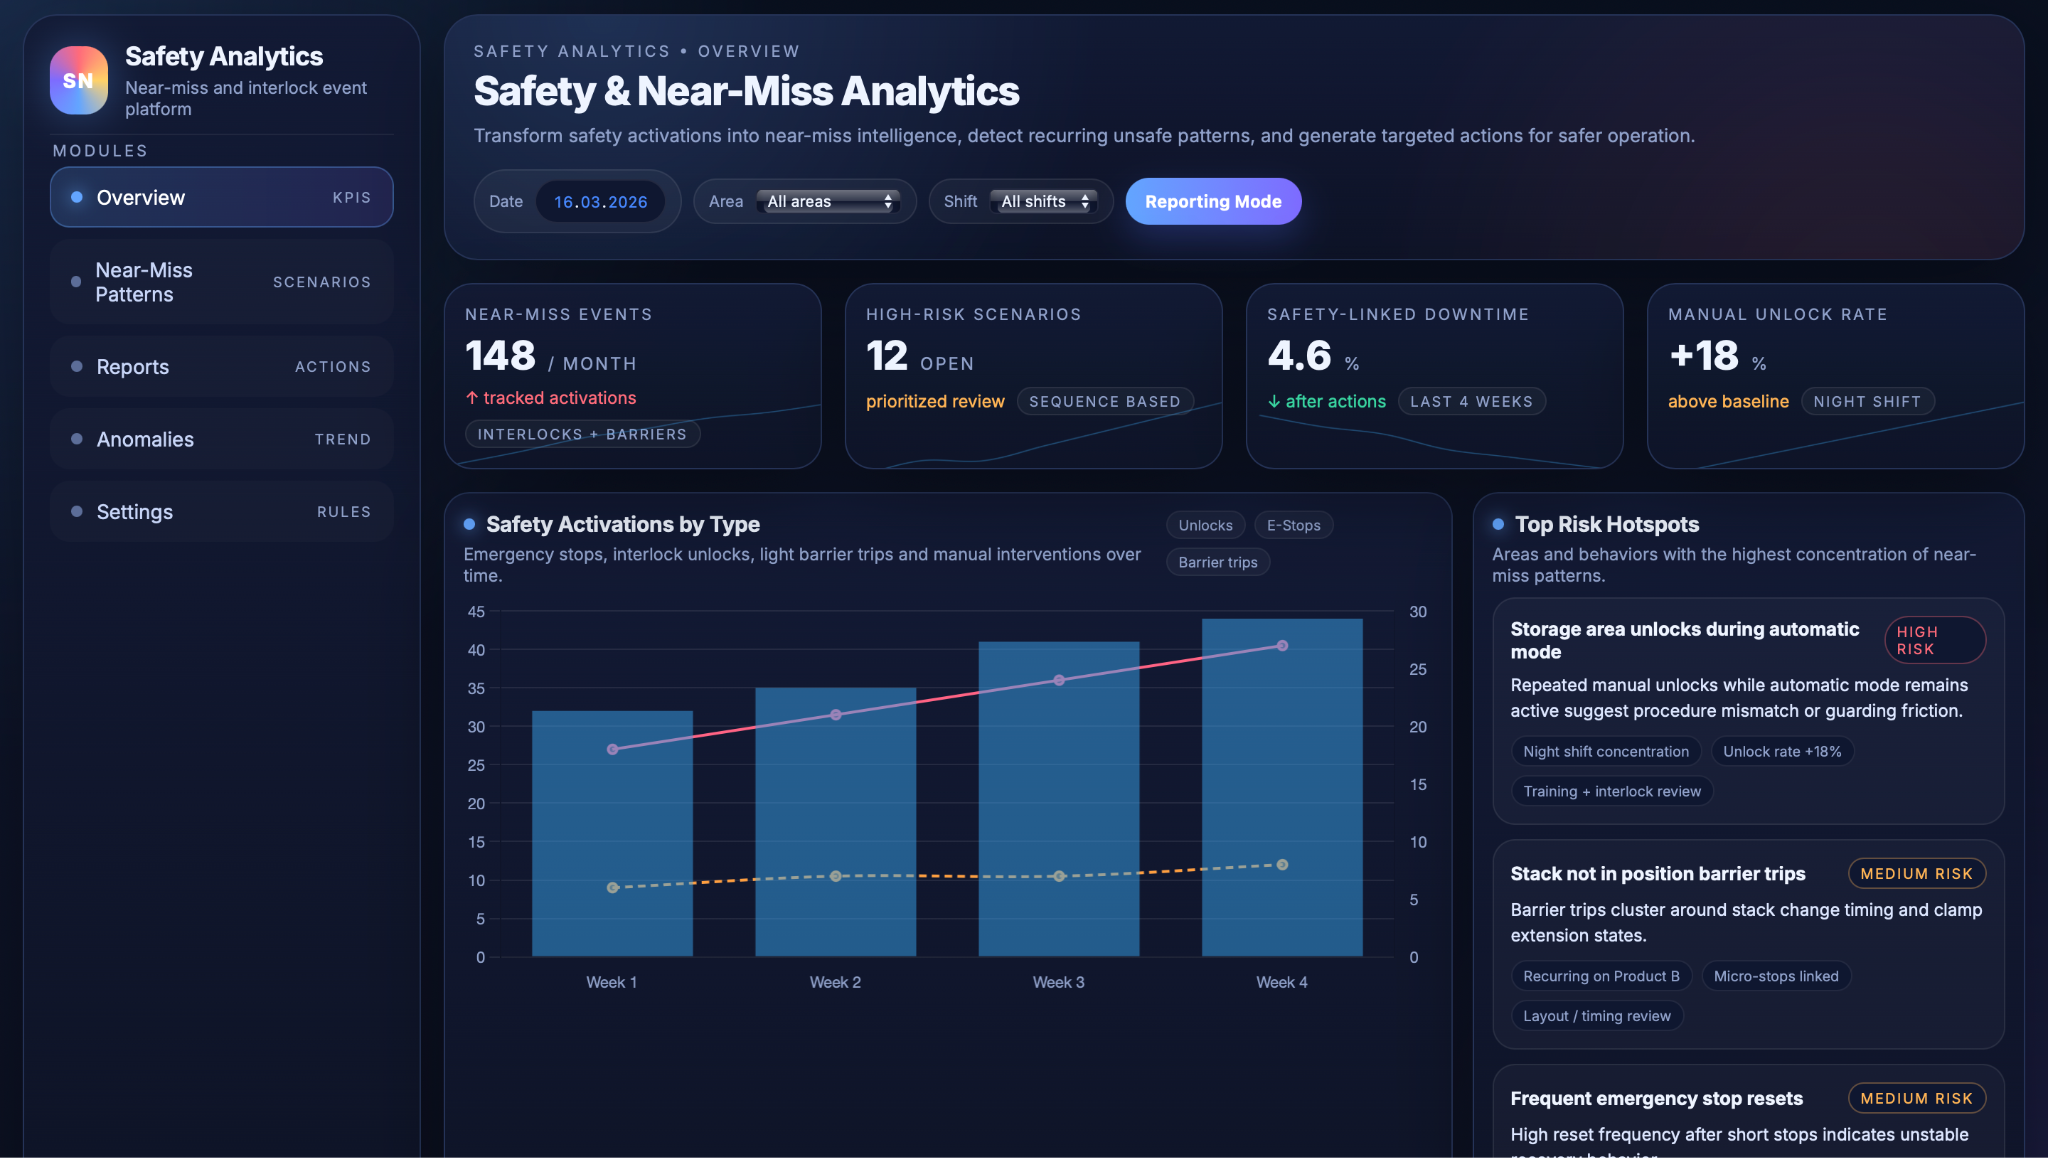
The safety KPI dashboard shows how often safety devices are activated, how those counts evolve over time, and how much downtime is linked to safety events. Key metrics include device activations by type and area, near‑miss event rates, safety‑linked downtime and manual unlock rates, giving supervisors and HSE teams a quick read on whether safety behaviour is improving or deteriorating and which parts of the line warrant closer attention.
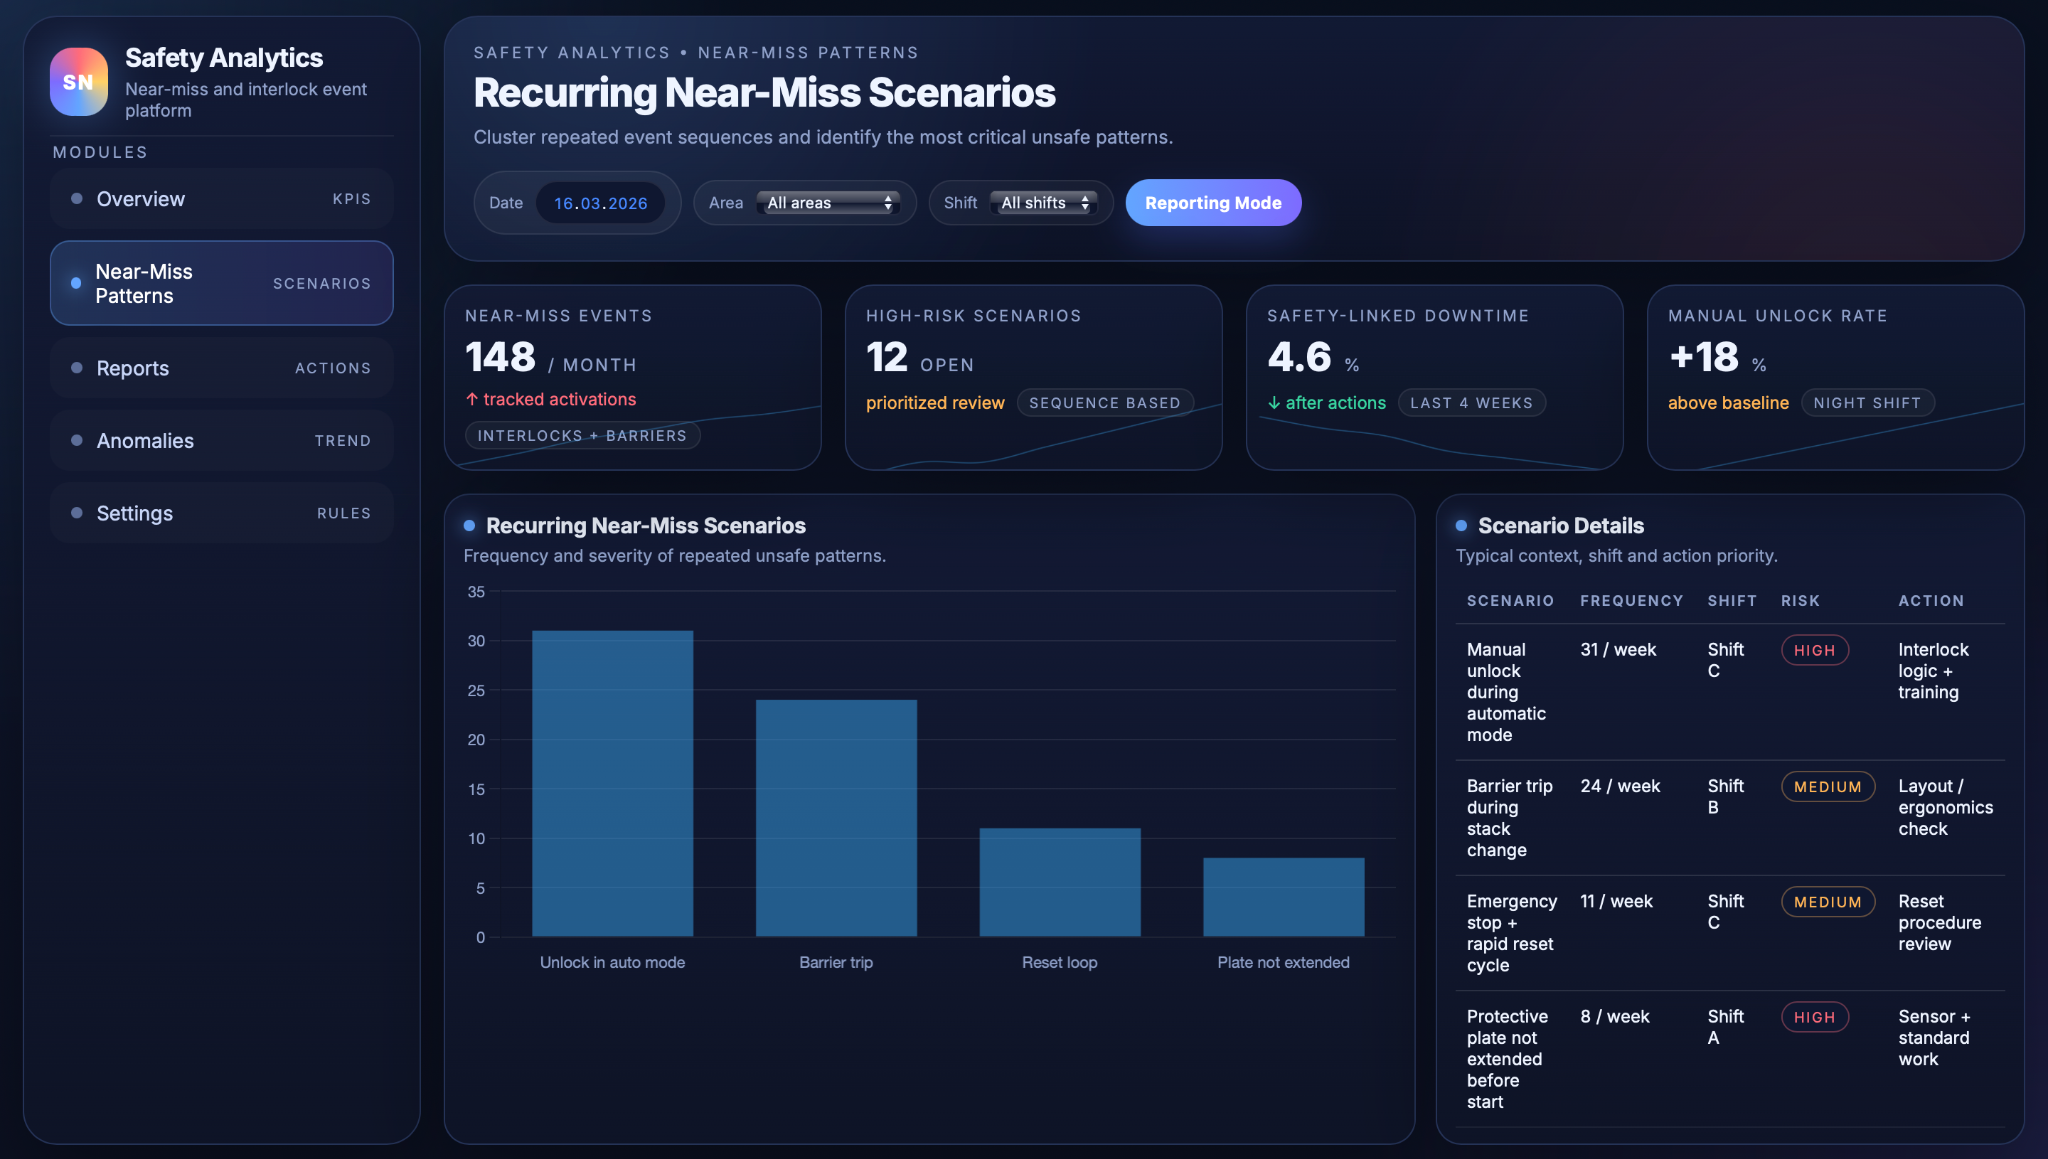
The near‑miss scenario view focuses on recurring patterns rather than individual events. It lists the most frequent scenarios together with their typical context (area, shift, product) and an indicative risk level, so that teams can see, for example, which combinations of shift and operation produce the most “stack not in position” trips or guard unlocks in automatic mode. This helps prioritise where to investigate procedures, ergonomics or guarding first and where to pilot corrective actions.
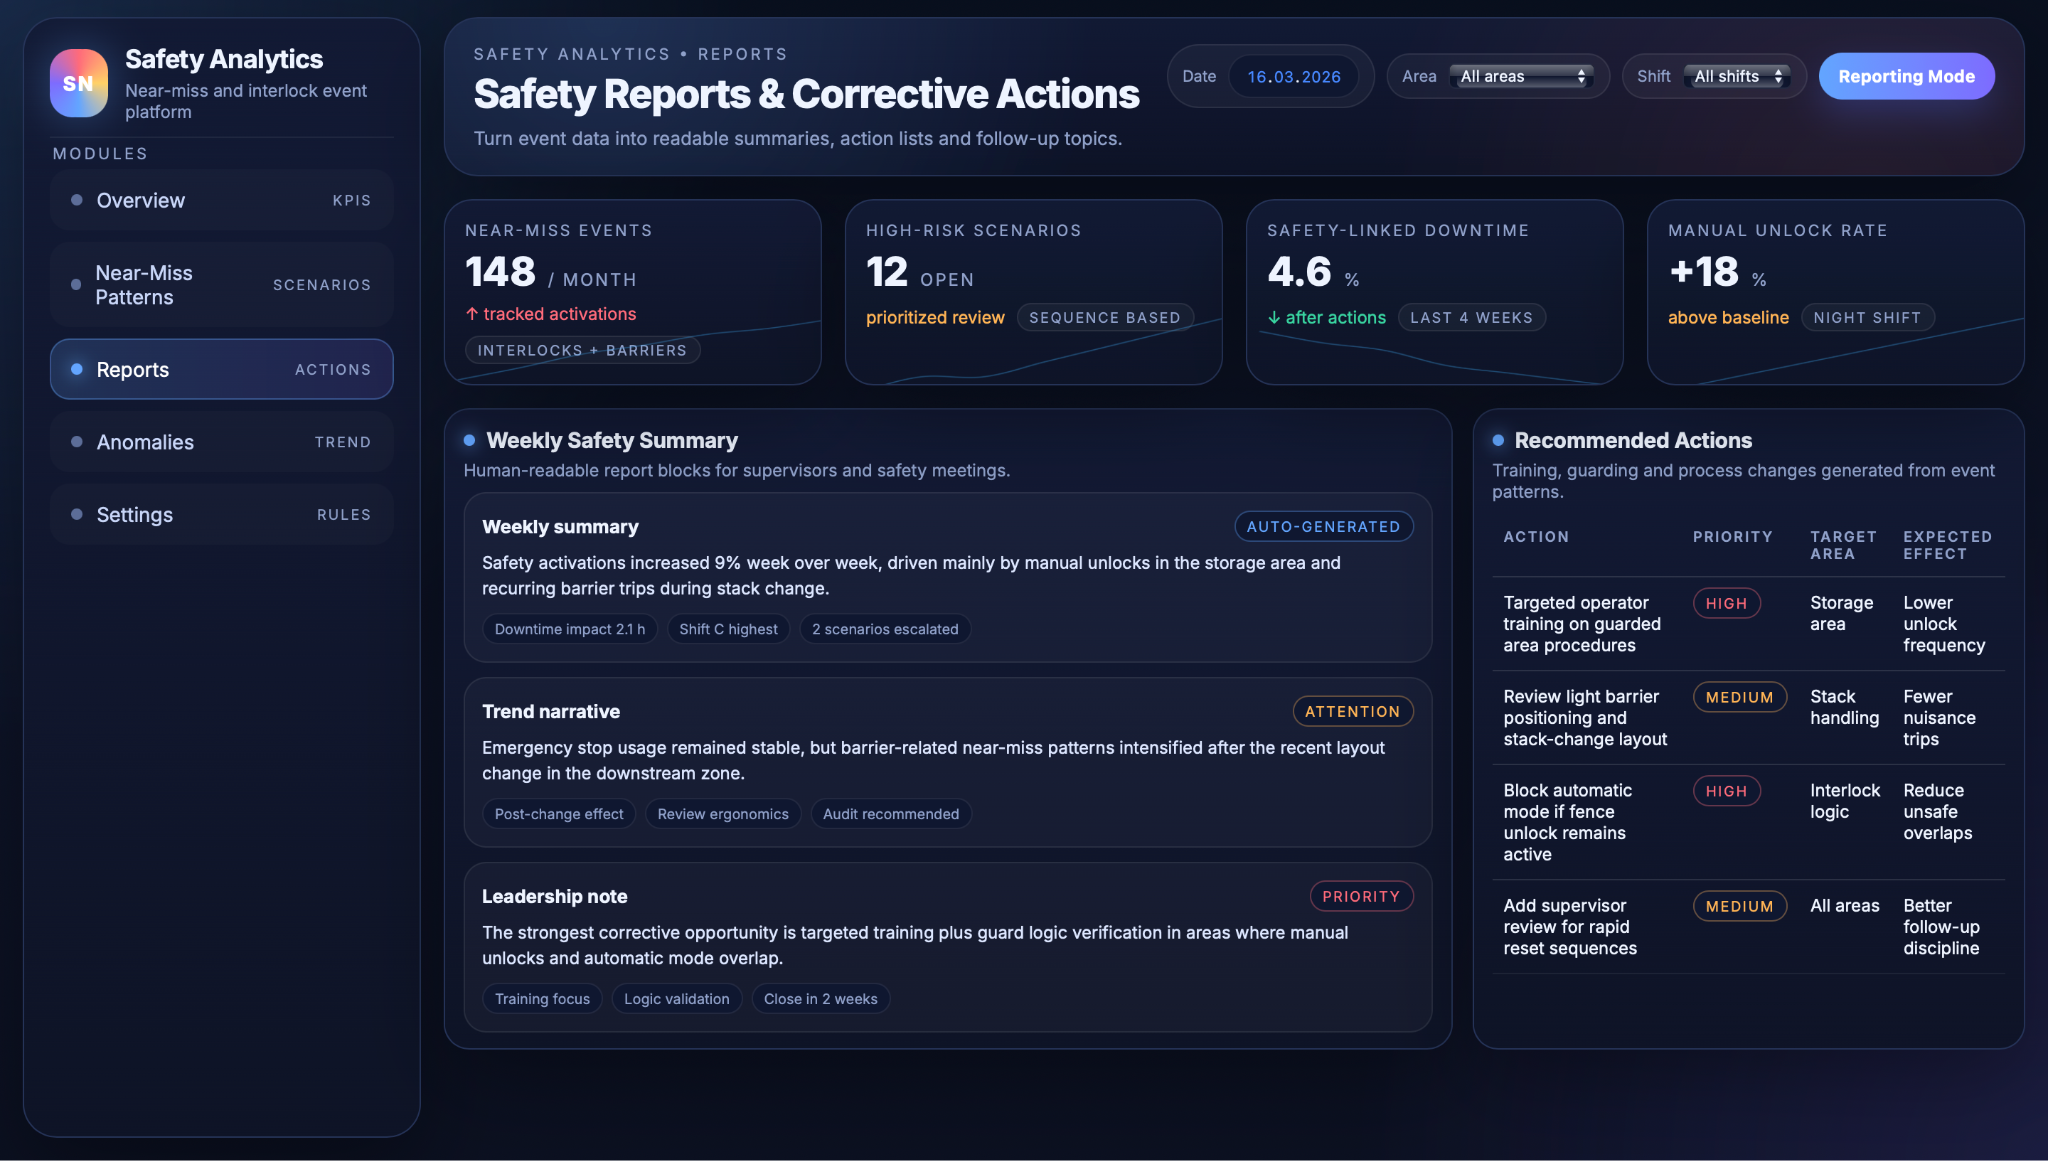
The reports and corrective‑actions workspace turns analytics into structured follow‑up work. Periodic reports generated by the LLM are available alongside action lists that capture recommended measures, priorities, target areas and expected effects, plus simple status tracking for open and closed actions. This makes it easier to run safety meetings, assign owners, and later review whether implemented actions have actually reduced near‑misses and safety‑related downtime, closing the loop between data and behaviour change.
The settings and thresholds view exposes key configuration options for the analytics logic and reporting cadence. Users can adjust sequence look‑back windows, high‑risk thresholds, anomaly‑detection options, reporting frequency and escalation rules, ensuring that the system reflects site‑specific policies and that safety, production and engineering teams share a common understanding of how near‑miss analytics behaves. In practice, this means the organisation can tune sensitivity, focus and report timing without code changes, keeping the tool aligned with evolving risk appetite and governance requirements.
Business Value
Safety, uptime and design improvements
The Safety & Near‑Miss Analytics use case delivers value across safety outcomes, line performance and long‑term design decisions. It turns everyday safety activations into a structured feedback loop that continuously sharpens both behaviour and engineering controls.
By identifying recurring near‑miss scenarios and high‑risk anomalies early, the system helps prevent accidents and serious incidents before they occur, rather than reacting only after recordable events. Systematic analysis of emergency stops, guard unlocks and light‑barrier trips highlights where procedures are unclear or workarounds have become normal, so these issues can be corrected through training, logic changes or layout tweaks.
The same insights reduce safety‑related downtime and nuisance stops by targeting frequent but non‑injury events such as repeated “stack not in position” trips or unnecessary emergency stops. Removing these chronic irritants improves line availability, stabilises cycle times and frees operators from constant small interruptions.
Data‑driven reports and transparent KPIs also strengthen safety culture and compliance. Teams discuss concrete patterns instead of anecdotes, can see whether actions are working, and have a traceable record for audits and regulatory reviews. Over time, this normalises near‑miss analysis as part of routine management rather than an occasional initiative.
Finally, the near‑miss patterns provide evidence for better guarding, ergonomics and layout design. Clusters of unlocks, fence stops or awkward resets show exactly where access, visibility or automation are misaligned with real work. Investments in new guarding concepts, ergonomics or automation can therefore be directed to the locations where they will most reduce risk and nuisance, giving both safety and productivity benefits.


Our success stories


.avif)


Tell us about your project needs


.png)