


The table of content
Introduction
The purpose of this use case is to stabilise the flow of material between process steps, storage buffers, and lift tables so that panels move smoothly through the production line without frequent stops or sudden overloads. When the flow is stable, throughput increases without adding new equipment, operators do not need to constantly monitor buffers, and the line becomes more predictable from shift to shift. Blocking and starvation are treated not as random problems but as measurable effects that can be analysed and improved using clear rules and digital models.
Buffers and bottlenecks play a key role because they determine how much of the installed capacity is actually used. If storage becomes full too often, upstream machines must wait even though they could continue running. If buffers become empty, downstream equipment stays idle and production output is lost. Because the limiting point of the line can change depending on product type, speed, or stack size, it is difficult to optimise by experience alone. By tracking where and when each part of the line becomes the bottleneck, the system shows which segment limits throughput and how buffer settings or speeds should be adjusted to keep the whole line balanced.
Data Used
Event data along the process and storage path
To understand how material really moves through the production line, the system uses signals that already exist along the path between processing units, storage buffers, and lift tables. It tracks when panels enter the next process step, when they move to storage, when buffers become full, and when material is missing. It also records stack movements, position signals, lift-table states, line speed, product type, order, and shift.
When viewed together, these signals show not only where the material is, but also when parts of the line are blocked by full buffers or waiting because no material has arrived.
Converting signals into an event log
All PLC signals are time-stamped and converted into a structured event log that describes what really happens on the line in the correct order. Instead of many low-level signals, the log contains clear events such as material entering a station, buffer becoming full, lift table reaching position, or stack movement starting. This event timeline is used to build and validate the digital model of the line. It helps estimate real processing times, buffer capacities, and typical waiting periods, and makes sure the model behaves the same way as the real system. Once the model matches reality, the same event data can be used to find bottlenecks and test different buffer or speed settings without disturbing production.
Technical Realisation
Discrete-event digital twin of the production line, storage and lift tables
At the core of this use case is a discrete-event digital twin that reproduces how panels move through the production line, storage buffers, and lift tables. Each process step is modelled using real cycle-time data, while conveyors and storage positions are represented as buffers with realistic capacities. Control rules from the PLC, such as position checks, transfer conditions, and safety interlocks, are included so that blocking and waiting in the model happen for the same reasons as in real production. The model is adjusted until simulated throughput, waiting time, and work-in-progress match the real line closely enough to be used for analysis and testing.
Bottleneck and buffer analytics in the twin
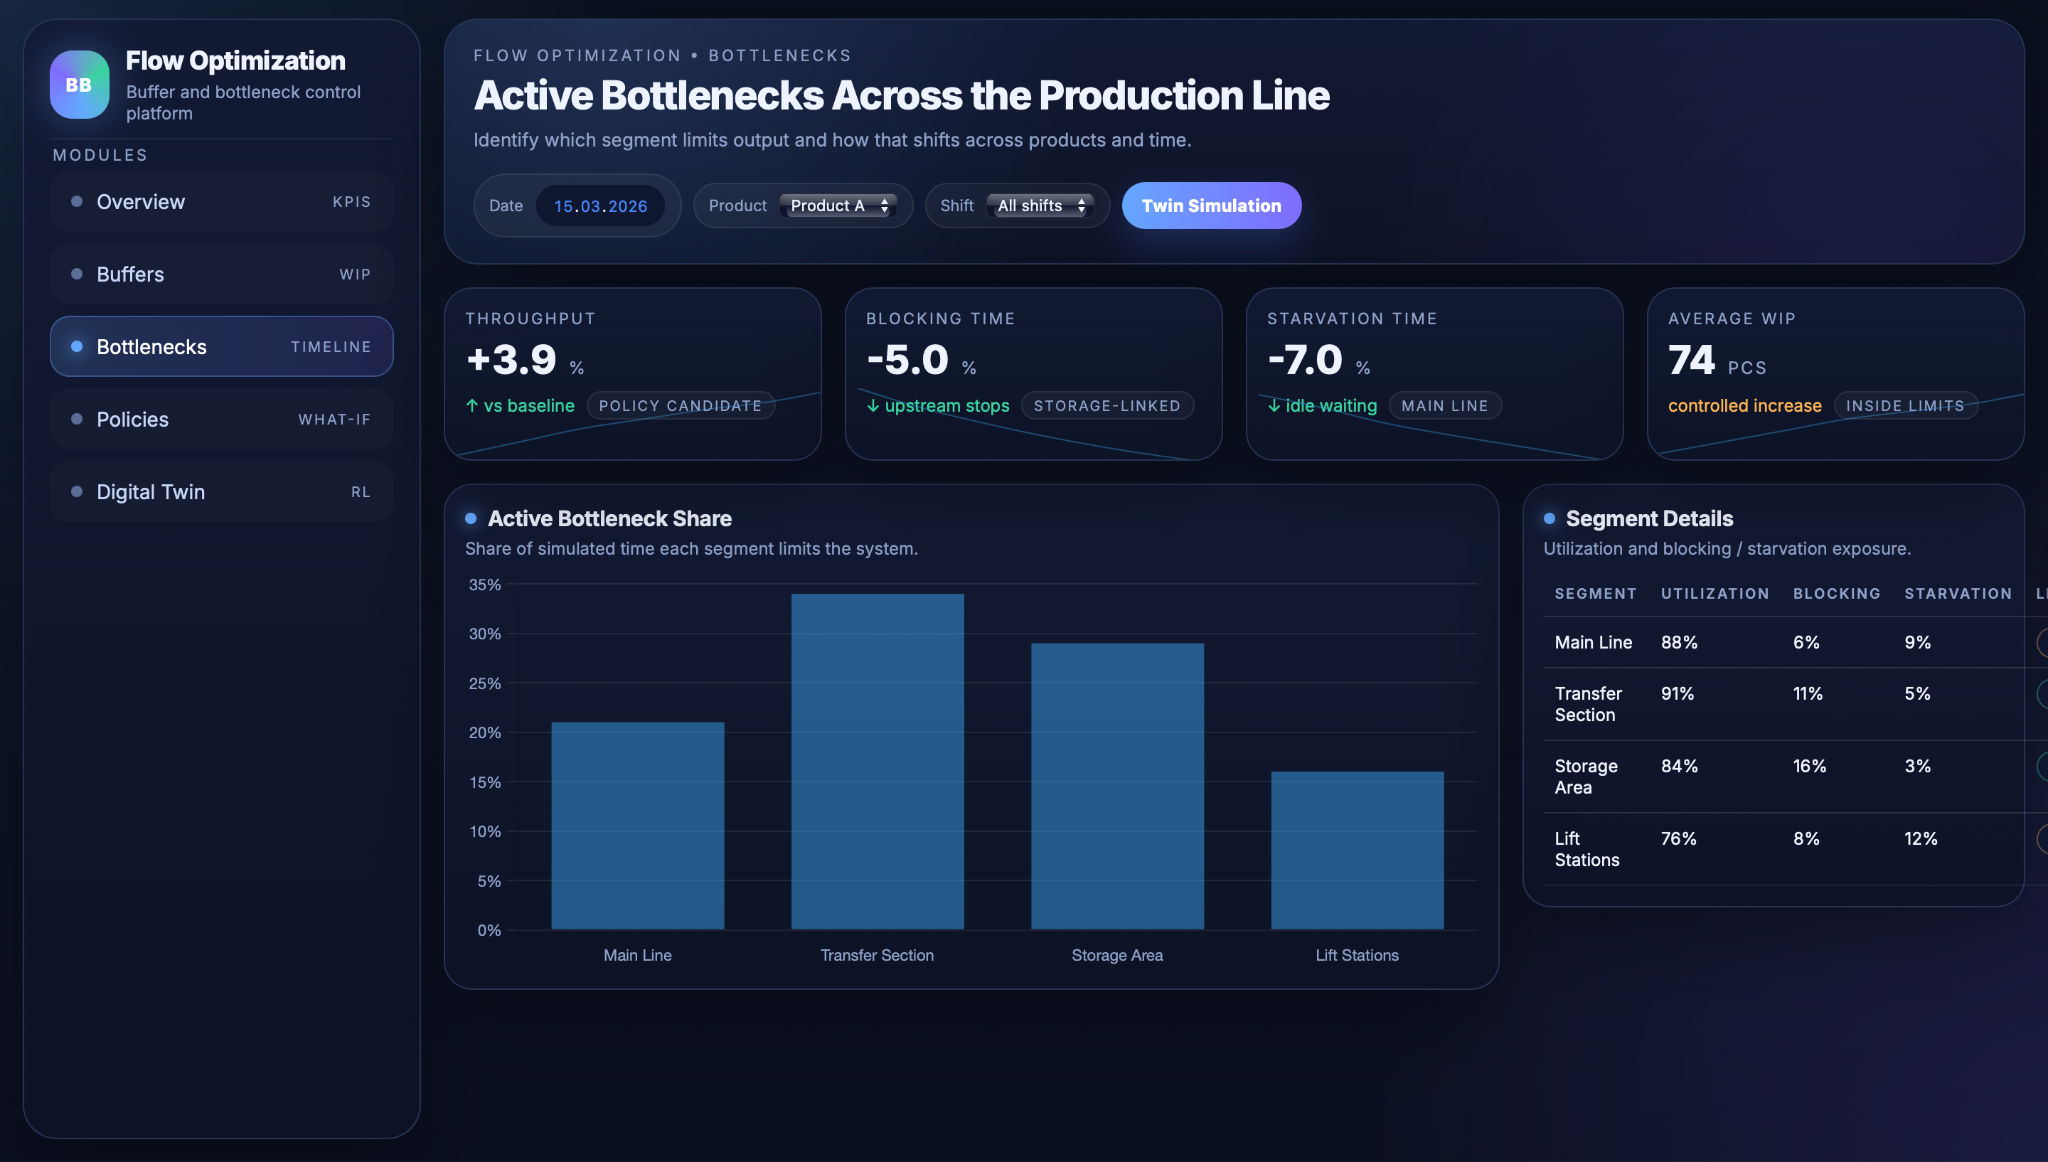
Once the model behaves like the real system, it can be used to analyse bottlenecks and buffer behaviour without affecting production. For each simulated shift, the system measures how long each part of the line is working, waiting for material, or blocked by full buffers. This makes it possible to see which segment limits throughput and how the bottleneck changes depending on product, speed, or stack size.
At the same time, buffer usage is tracked over time, including how often buffers are full or empty and how often these states cause the line to stop. These results show which buffers are too small, too large, or poorly controlled, and where small changes in capacity or control rules could improve flow stability the most.
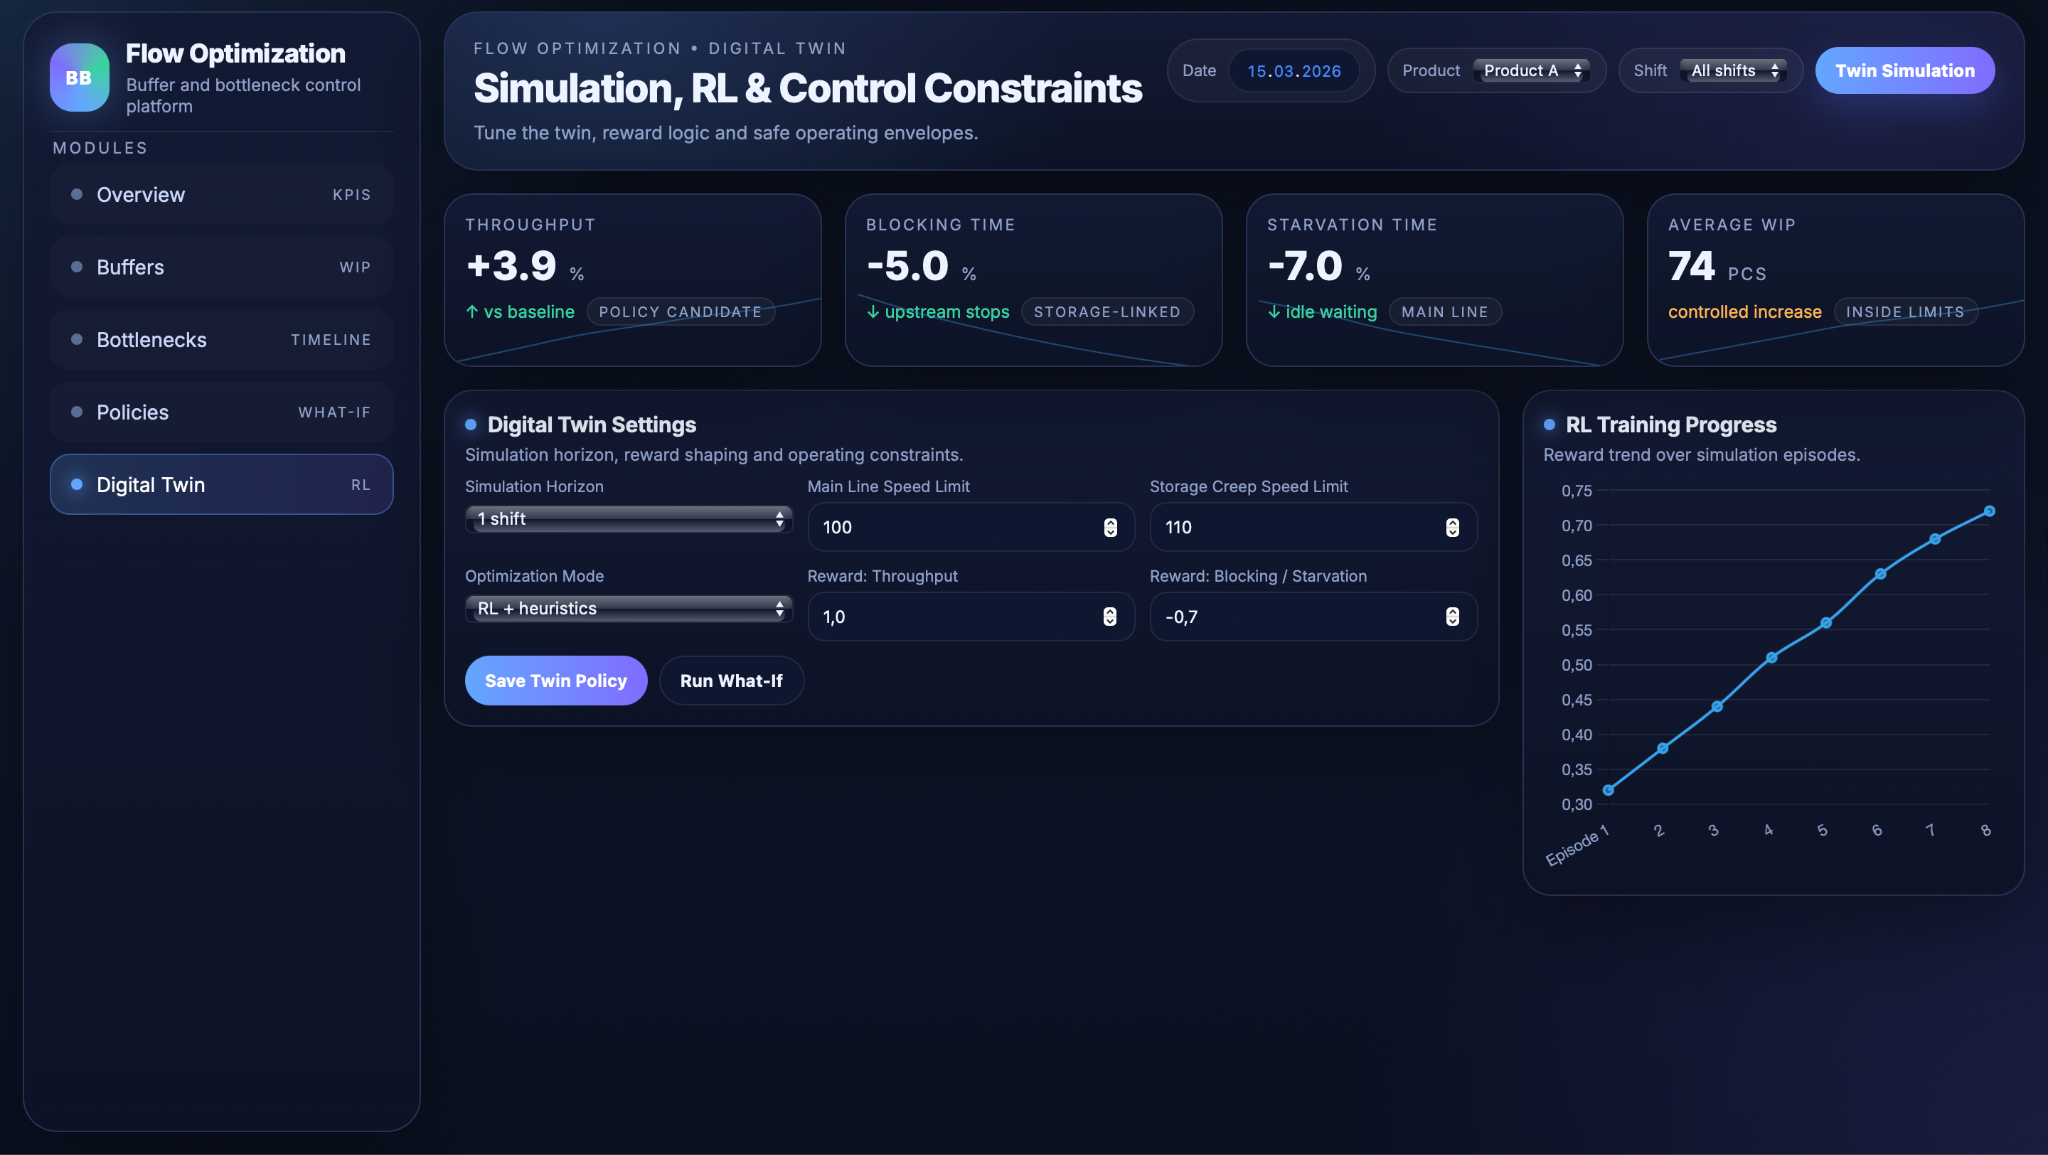
AI-based speed and buffer policy optimization
After the digital twin is calibrated, AI methods are used to find better speed and buffer settings without affecting the real production line. Simple approaches test fixed rules, for example slowing one part of the line when buffers become too full or increasing transport speed when downstream stations are waiting. The effect of these rules is checked in simulation by comparing throughput, blocking, and starvation time. More advanced methods use reinforcement learning, where the system runs many simulated shifts and tries different speed and buffer settings. It receives a better score when throughput increases and waiting time decreases, and over time it learns which settings give the best results. Because this testing happens only in the digital model, thousands of combinations can be evaluated safely. The result is a small set of clear rules that improve flow stability and throughput. These rules can then be reviewed by engineers and applied in practice, either as control logic or as recommended operating guidelines.
Dashboards and Operator Support
Visualising bottlenecks, blocking
and starvation
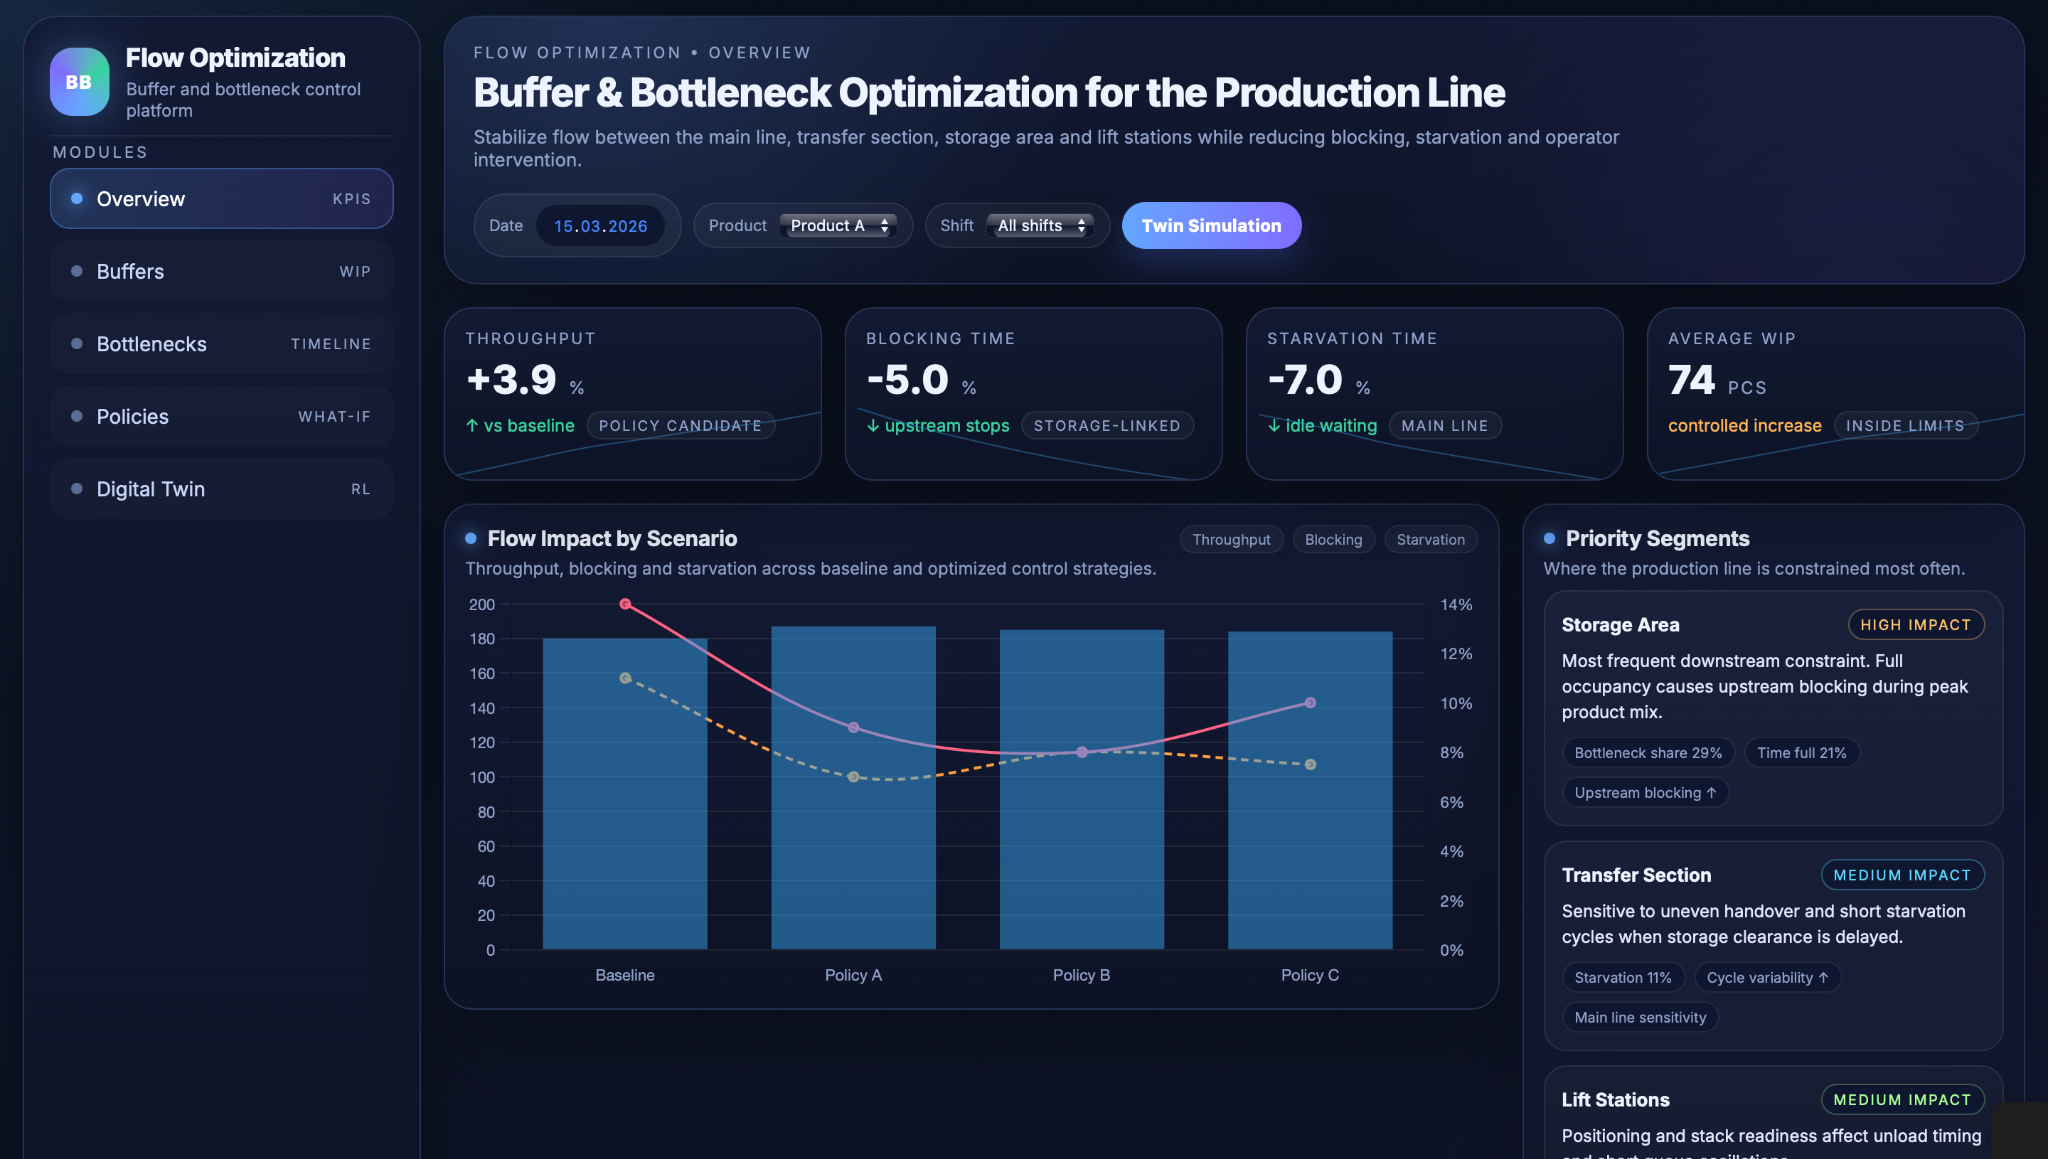
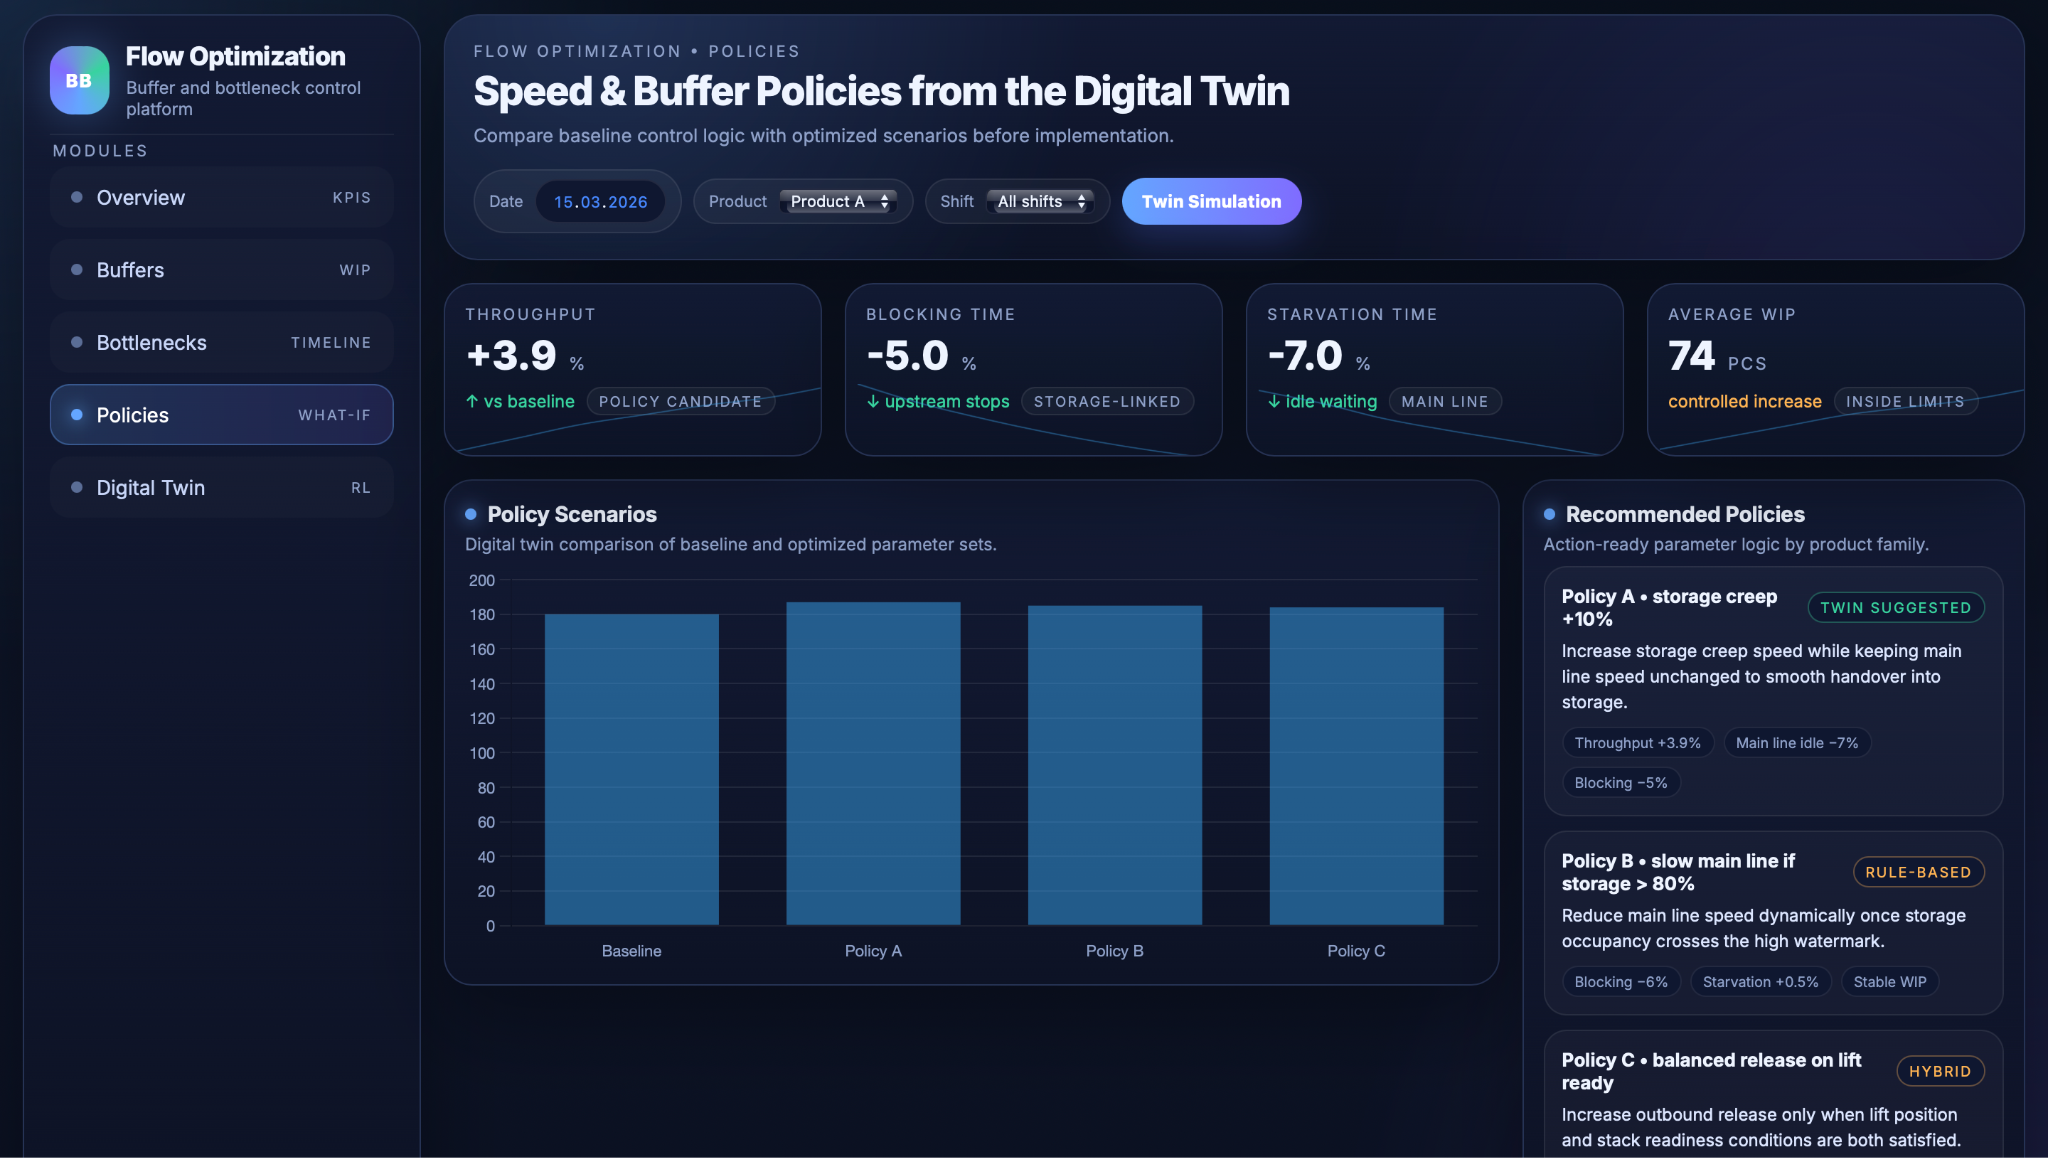
Dashboards present the results of the digital twin in a form that can be used in daily work. For each shift, they show throughput together with the share of time lost to blocking and starvation, so the team can quickly see whether flow stability is improving or getting worse. A bottleneck view highlights which part of the line limits production over time, helping engineers focus on the real constraint instead of relying on assumptions.
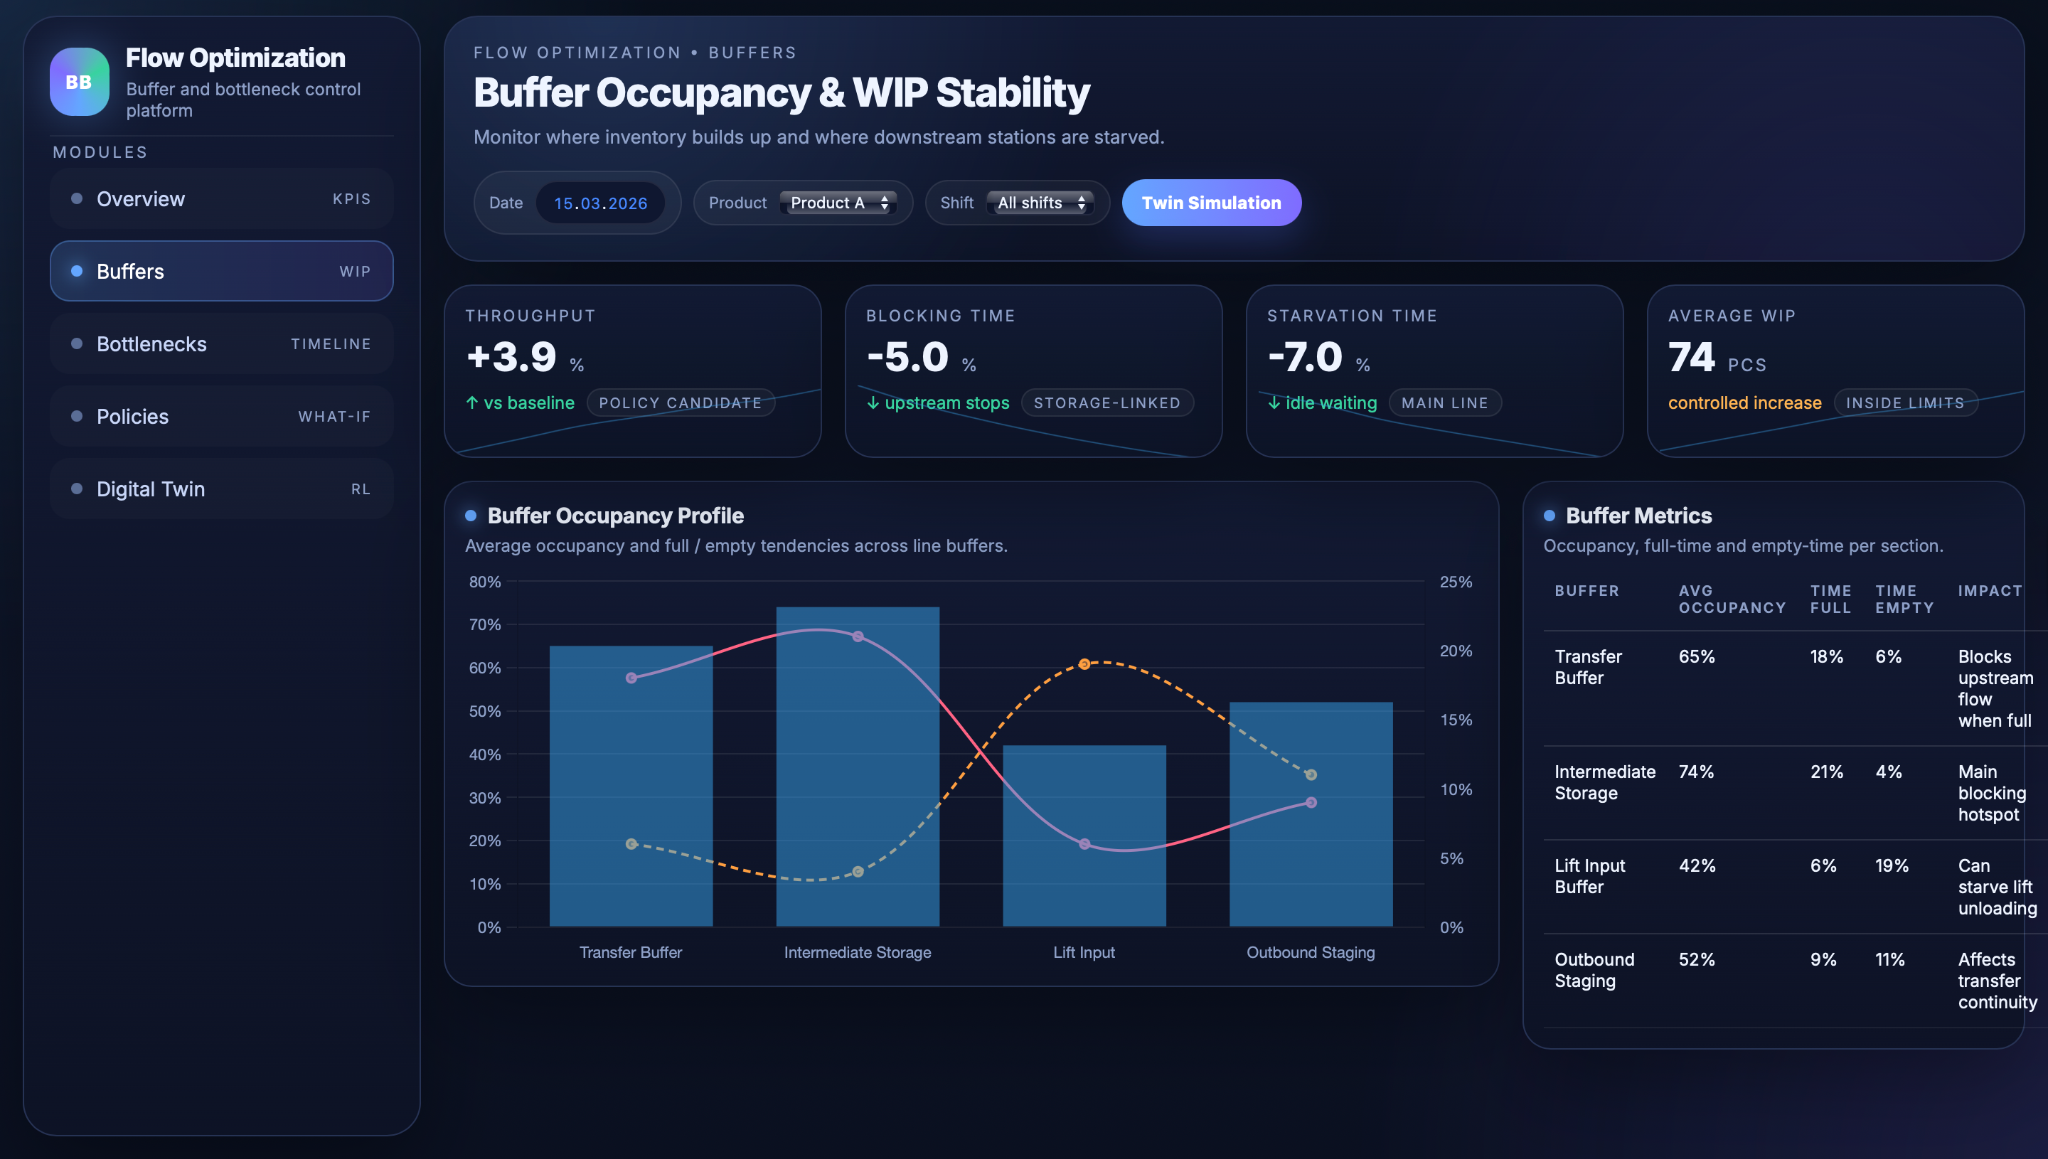
Buffer metrics and occupancy profiles
Buffers are analysed separately because they strongly influence flow stability. Charts show how full each buffer typically is and how often it becomes full or empty. These states are explained in simple terms, for example when a full buffer stops upstream production or an empty buffer causes downstream waiting. This makes it easier to see whether buffers are working correctly or if speed settings, capacity, or control rules should be changed.
Policy recommendations and workflow integration
To make the optimisation usable in practice, the system summarises the best settings as simple recommendations for each product or product group. These can include speed values, buffer limits, or slowdown thresholds together with the expected effect on throughput and waiting time. The recommendations can be added to operating instructions, control recipes, or operator guidelines, and are reviewed regularly so that settings stay aligned with the current production mix instead of being adjusted only once.
Business Value and Conclusions
By reducing the time the line spends blocked or starved, the use case increases the number of panels that can be processed with the equipment already installed. Instead of investing in new machines, the factory gains additional effective capacity by running the line in a more balanced and controlled way. This makes it easier to handle higher demand, absorb production peaks, and keep delivery times stable without large capital investments.
Better control of buffers and speeds also makes the material flow more stable. When the line runs with fewer sudden stops, overloads, or empty sections, operators do not need to constantly adjust settings based on intuition. Clear rules, better visibility, and validated policies reduce the need for manual intervention and help shifts run more smoothly. As a result, operator stress is lower, the process feels more predictable, and the risk of mistakes caused by time pressure is reduced.
Another important benefit is improved visibility of bottlenecks. Instead of guessing which part of the line limits production, the digital twin and dashboards show exactly where time is lost and how this changes with product mix, speed settings, or stack sizes. This allows engineers and managers to focus improvement work where it has the biggest effect, whether this means changing buffer policies, adjusting speeds, or investing in a specific mechanical upgrade. Time and budget can be used more efficiently because decisions are based on measured data rather than assumptions.
The use case also supports long-term optimisation, not just one-time tuning. Because the model is built on real production data, it can be updated whenever operating conditions change. When new products are introduced, speeds are increased, or working practices evolve, the same digital twin can be recalibrated and used to test new buffer and speed settings safely in simulation. This creates a continuous improvement loop where the line is reviewed and optimised regularly, keeping performance close to the theoretical maximum instead of slowly drifting away from it.
Over time, this approach helps the factory move from reactive adjustments to systematic optimisation. Flow stability improves, throughput becomes more predictable, and the gap between installed capacity and actual output becomes smaller. The result is a production line that runs closer to its real potential, with fewer surprises, lower stress for the team, and better use of existing equipment.


Our success stories


.avif)


Tell us about your project needs


.png)